llama.cpp KV Cache Quantization: Why q8_0 Costs 9% of Throughput — or 22%
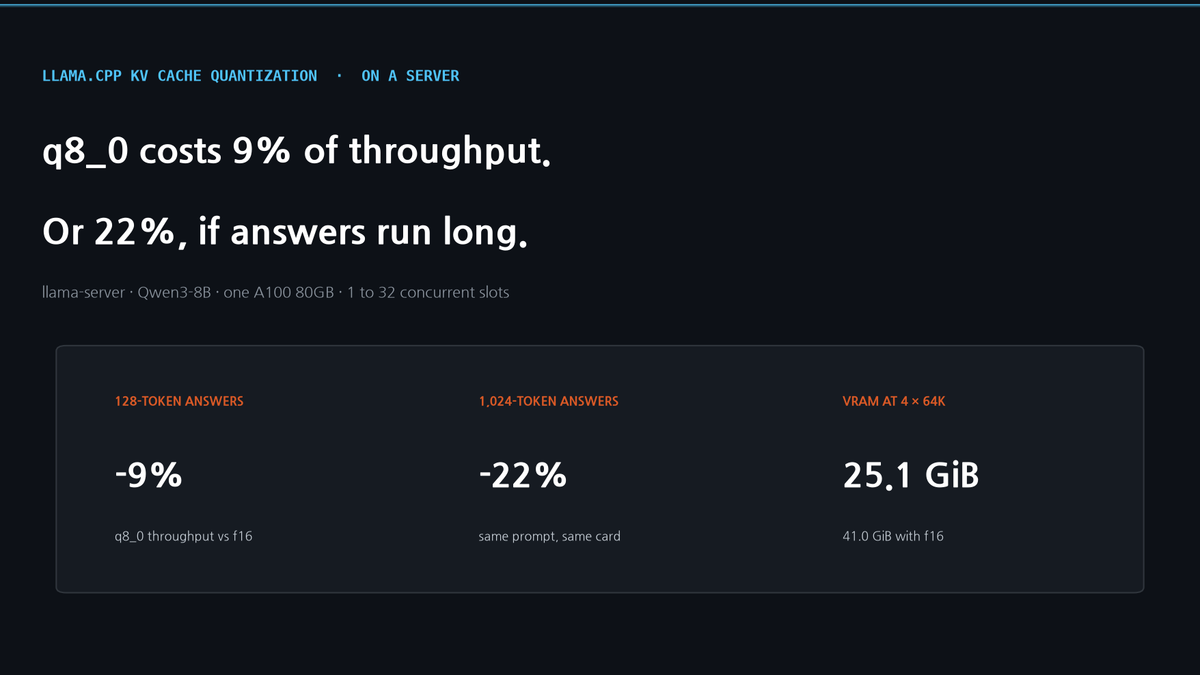
Mainline llama.cpp on one A100, Qwen3-8B Q4_K_M, llama-server with 1 to 32 concurrent slots. On a 32K prompt, q8_0 cost 9% of server throughput when each request generated 128 tokens and 22% when it generated 1,024, because prefill dominates the short case and prefill is unaffected by the KV type. Per-token decode was 34% slower, matching llama-bench. VRAM in use after startup fell from 41.0 GiB to 25.1 GiB at four 64K slots.
llama.cpp KV Cache Quantization: Why q8_0 Costs 9% of Throughput — or 22%
The last post measured KV cache quantization with llama-bench and ended with a limitation I wrote myself: batch size one throughout, a single decode stream, and batched serving changes the bandwidth picture. That sentence is this post's question.
People searching llama.cpp kv cache quantization are usually not running llama-bench. They are running llama-server with concurrent slots and want to know what -ctk q8_0 -ctv q8_0 costs there. It turns out the answer is not one number. The same setting cost 9% of throughput in one workload and 22% in another on the same card, and the difference is how many tokens each request generates.
Same card, same model, same build as the previous post, so the two sets of numbers sit next to each other.
Rig
One A100 80GB PCIe, driver 535. llama.cpp mainline, ggml-org master 69320fe (2026-09-02), CUDA build for sm80 — the same commit as the previous post. Qwen3-8B at Q4_K_M. Every server runs -fa 1 -ngl 99 --no-context-shift with -np slots and -c set to slots × per-slot context. Prompts are synthetic repeated text, trimmed with the server's own tokenizer so every KV type sees the same prompt length.
Load comes from an asyncio client that opens -np concurrent streaming requests with temperature 0 and cache_prompt false, so every request pays full prefill. One warm-up round is discarded.
Three definitions, because they are not interchangeable:
- TTFT is from sending the request to the arrival of the first SSE message carrying content.
- Per-stream speed is measured per request as the span from its first to its last content message divided by the number of content messages minus one. The median of those per-request values is then inverted. It is not the median of per-request token rates.
- Throughput is every request's output tokens divided by wall clock, so it includes the prefill window when nothing is being generated yet.
Token counts come from the server's own timings.predicted_n in the final message. Across all 33 configurations here, the client's count of content messages matched that number exactly, so the two agree on what a token is. The server also reports predicted_per_second, which excludes network and client scheduling; at one concurrent request it lands within 0.1 tok/s of the client figure, and at 4 slots it reads 4 to 9% higher, which is the client absorbing scheduling delay that the server does not count.
Only f16, q8_0 and q4_0 are here. In the previous post, q5_1 and the K q8_0 / V q4_0 mix prefilled 8K tokens at 43 and 63 tokens per second against f16's 4,539, with GPU utilisation sitting at 2 to 4% during the run. I did not establish the mechanism there and have not established it here either.
Per-token decode matches llama-bench
Worth checking first, because the two tools measure along different paths. Per-stream generation speed at one concurrent request:
- 8K prompt: f16 129.3, q8_0 107.7 (83%), q4_0 104.8 tok/s (81%).
- 32K prompt: f16 101.3, q8_0 66.7 (66%), q4_0 62.6 tok/s (62%).
The previous post's llama-bench decode at the same depths read 134.4 / 110.2 (82%) / 107.2 (80%) at 8K and 105.0 / 68.0 (65%) / 63.6 (61%) at 32K. The ratios agree to within a point. Two different binaries measured under different harnesses land in the same place, which is what you want before building anything on either.
Note the units. At 32K, q8_0 runs at 66% of f16's rate, which means the same number of tokens takes about 52% longer to produce, not 34% longer. Rates and durations invert; the two numbers describe one fact.
A server loses much less than that
The same runs measured as a server — total output tokens divided by wall clock, which is what decides how many requests per hour the box handles. q8_0 as a percentage of f16:
- 2,048-token prompt, 128 output: 92% at one slot, 94% at 4, 91% at 16, 90% at 32.
- 8,192-token prompt, 128 output: 92% at 1, 94% at 4, 92% at 16.
- 32,768-token prompt, 128 output: 91% at 1, 94% at 4.
A per-token penalty that reaches 52% in duration shows up as a 6 to 9% throughput penalty, and the clock says why. With a 32K prompt, 128 output tokens and one slot, f16 took 10.04 s to first token and 1.26 s to produce the rest; q8_0 took 10.49 s and 1.90 s. Prefill grew by 0.45 s, generation by 0.64 s, and the request as a whole went from 11.3 s to 12.4 s. Prefill is the larger share and it moves the least, because it reads the cache as it builds it rather than re-reading the whole cache on every step.
Across the 128-token configurations measured here — 1 to 32 slots at a 2K prompt, 1 to 16 at 8K, 1 to 4 at 32K — the ratio stayed between 90 and 94% with no trend in concurrency. That is an absence of an effect in the range tested, not evidence that none exists at higher concurrency or longer prompts; 32 slots was only measured at the 2K prompt.
TTFT is close but not identical. At one concurrent request the three types are within 0.5 s of each other at every prompt size. At 16 slots with an 8K prompt they spread further: f16 17.60 s against q8_0 17.94 s, a difference of 0.34 s.
Output length moves the number
The arithmetic above says the penalty should grow as generation takes a larger share of the request, so I ran it rather than projecting it. Same 32K prompt, output raised from 128 to 1,024 tokens:
- One slot: f16 50.7, q8_0 39.4 (78%), q4_0 38.0 tok/s (75%).
- Four slots: f16 60.6, q8_0 46.3 (76%), q4_0 44.6 tok/s (74%).
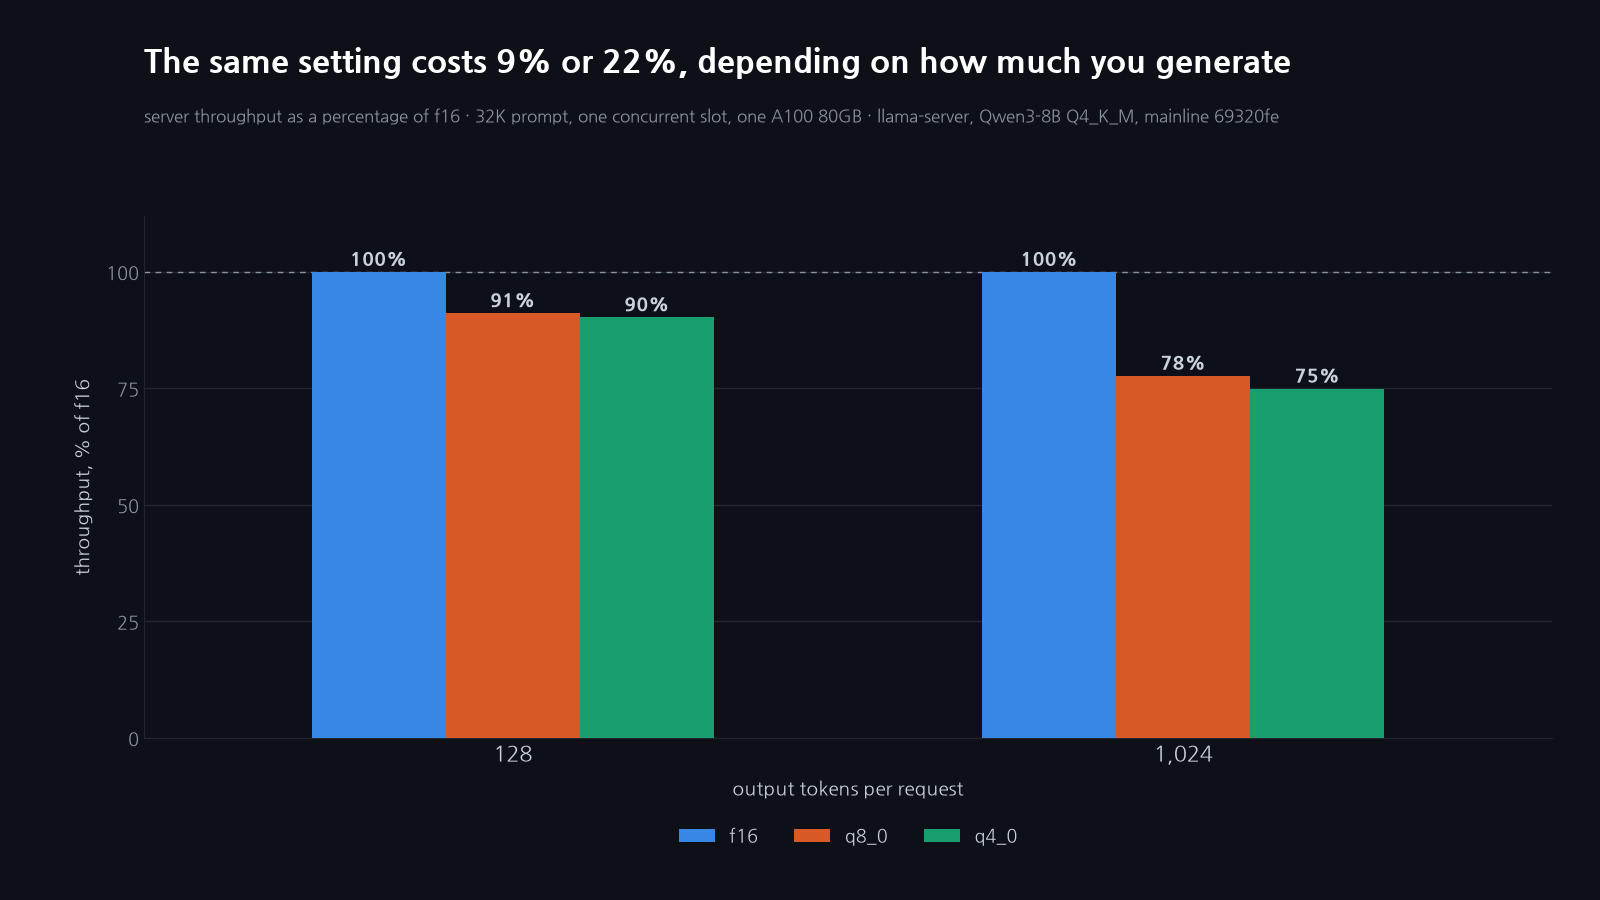
So on the same 32K input, raising the answer from 128 to 1,024 tokens moved the throughput loss from 6 to 9% up to 22 to 26%. I have two points on that curve, not a threshold: at a 1:256 output-to-input ratio the cost is around 9%, and at 1:32 it is around 22%. Where it crosses any particular budget is something you would have to measure at your own ratio.
The per-stream column behaves differently in the two cases. At 128 output tokens with 4 or 16 slots it reads 84 to 88%, while the same configuration at one slot reads 62 to 66%. At 1,024 output tokens it reads 62 to 66% at both 1 and 4 slots. The short-output runs generate for only a second or two while prefills are still staggered across slots, so the per-request span being measured is short and overlaps other slots' prefill; I did not repeat runs or trace the scheduler, so I can describe the difference but not attribute it.
Memory is where the difference is large
VRAM in use on the card once the server reported healthy, before any load, including the 4.68 GiB of weights. Sampling every 0.5 s during the load run never moved these by more than 14 MiB, which is expected: llama.cpp allocates the whole cache at startup.
- 4,096 per slot, 32 slots: f16 23.0 GiB, q8_0 15.0, q4_0 10.5.
- 16,384 per slot, 16 slots: f16 41.0 GiB, q8_0 25.1, q4_0 16.1.
- 65,536 per slot, 4 slots: f16 41.0 GiB, q8_0 25.1, q4_0 16.1.
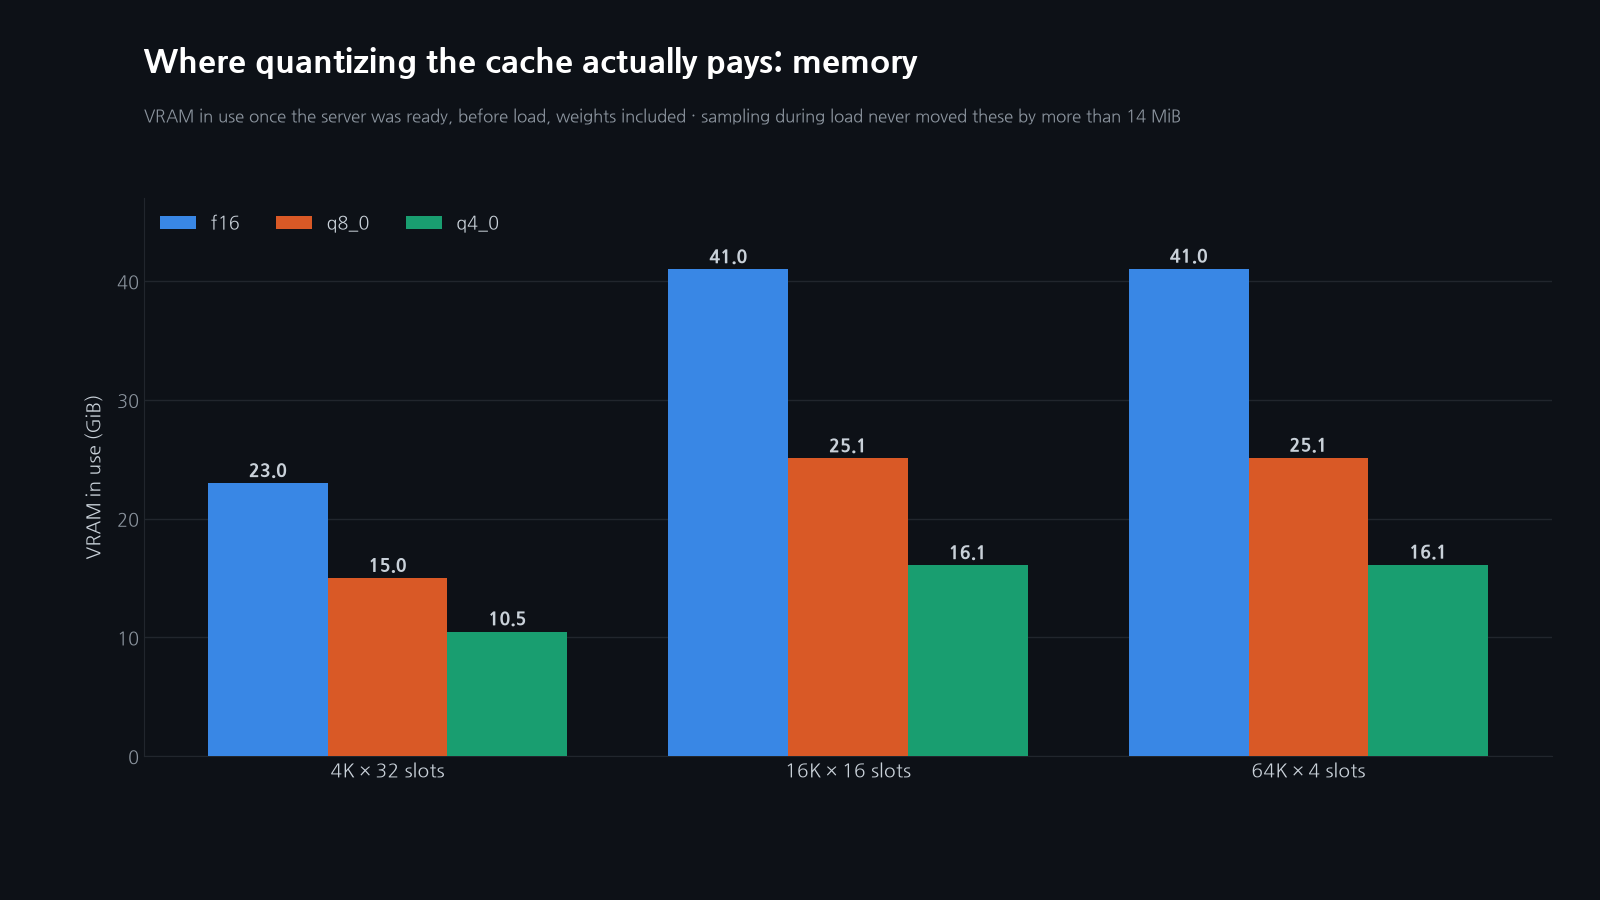
The saving scales with slots times context, which is total cache. At four 64K slots, q8_0 holds 15.9 GiB less than f16 and q4_0 24.9 GiB less. On an A100 80GB serving an 8B model none of those configurations is close to the limit — f16 at 32 slots sits at 23.0 GiB — so the memory is not what constrains this particular box. On a card where 41 GiB does not fit, the same three rows are a capacity decision rather than a speed one, though I have only measured them on this card.
What to set
If the f16 cache fits with room to spare, keep f16. You would be paying 6 to 26% of throughput, depending on your output length, for memory you were not short of.
If it does not fit, -ctk q8_0 -ctv q8_0 is the first thing to try. Its perplexity was inside the f16 error bars at every context length tested in the previous post, and its throughput here is within a point of q4_0 everywhere. q4_0 holds a further 9.0 GiB at four 64K slots and cost 0.5 to 1.1% perplexity in the previous post, which makes it the choice only when that 9 GiB decides whether the configuration loads.
If your requests generate long answers, measure your own output-to-input ratio first. The 9% figure belongs to 128-token answers on a 32K prompt.
What this does not show
One model at one weight quantization on one card. Qwen3-8B uses 4:1 GQA with 8 KV heads; a model with more KV heads has a bigger cache per token, and the penalty would plausibly grow with it, though I have not measured that. Prompts are synthetic repeated text, identical across slots, which real traffic is not, and cache_prompt false removes the prefix reuse a real server would get. Every run is a single burst of -np simultaneous requests rather than a steady arrival process, so there is no queueing behaviour here and no p99 worth quoting. Each configuration was run once after a discarded warm-up, so small differences between adjacent rows are not resolvable.
And this is commit 69320fe on sm80. The quantized-KV decode path roughly doubled in speed between the fork measured two posts ago and this commit, so these ratios will move again.
New measurements go out weekly with Paper of the Week — subscribe below if you want the next one.
Rig: A100 80GB PCIe × 1 (second card idle), driver 535. llama.cpp 69320fe (ggml-org master, 2026-09-02), CUDA build for sm80. Qwen3-8B Q4_K_M, llama-server -fa 1 -ngl 99 --no-context-shift. Harness scripts/bench-llamacpp-server.sh and scripts/bench-server-client.py; raw per-request JSON, server timings and VRAM samples in drafts/llamacpp-server-kv-bench/. Verified on 2026-09-17.
Subscribe to Newsletter
Related Posts
llama.cpp KV Cache Quantization, Measured on One A100 — q8_0 Is Free at 4K and Costs Half Your Decode Speed at 64K
Mainline llama.cpp, Qwen3-8B, one A100: -ctk q8_0 -ctv q8_0 matches f16 perplexity and cuts the 32K cache by 2.1 GiB, but decode at 64K depth drops to 55% of f16 (q4_0: 50%). Two other settings, q5_1 and a q8_0/q4_0 mix, silently ran prefill on the CPU at 43 and 63 tokens per second.
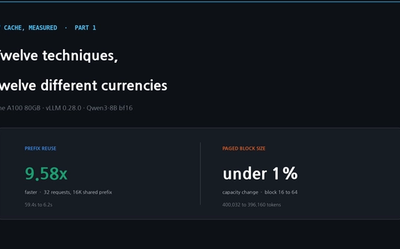
KV Cache Reduction, Measured on One A100 — Part 1: The Twelve Techniques Don't Pay in the Same Currency
Every list of KV cache techniques presents a dozen of them as peers. On one A100 the spread is enormous: prefix reuse cut a shared-prefix workload from 59.4s to 6.2s, while tuning the paged block size moved capacity by under 1%. The reason you cannot rank them on one number is that they pay out in different units.
TurboQuant in vLLM on One A100 — Capacity, Speed, and Accuracy of All Four Presets on an 8B Model
vLLM 0.28, Qwen3-8B bf16, one A100 80GB: KV capacity, batched throughput, 32K decode, needle-in-haystack, and GSM8K for bf16, fp8, and all four TurboQuant presets — the 8B size vLLM's own study skipped.