Same GPT-2, Same Data, Three Seeds: The Final Loss Spread 0.018 Nats
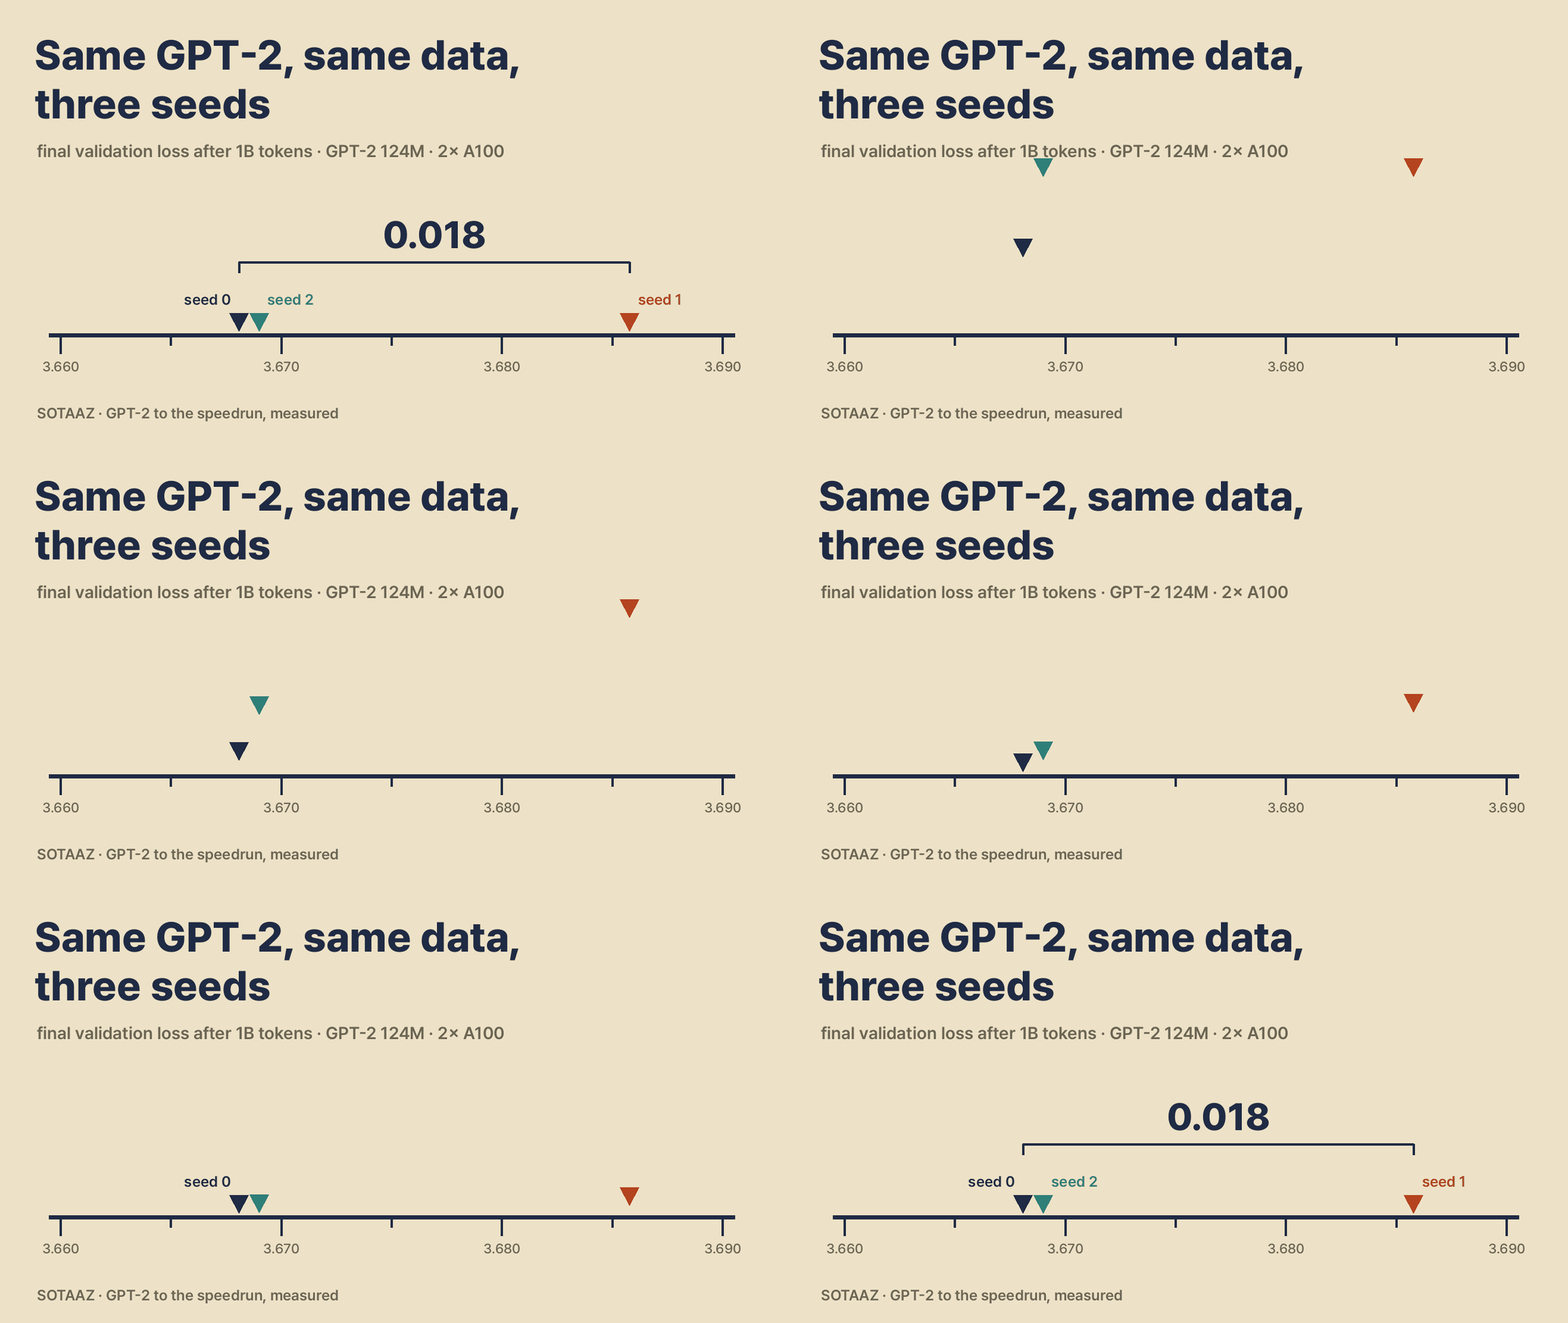
Three GPT-2 (124M) runs on 1B FineWeb-Edu tokens that differed only in the random seed ended at 3.668, 3.669 and 3.686 validation loss (sd 0.010). Seed 0 run again with the same command landed 0.0035 away. With three seeds per side, a change has to beat 0.016 nats before this series calls it real.
Same GPT-2, Same Data, Three Seeds: The Final Loss Spread 0.018 Nats
I trained GPT-2 (124M) on the same billion tokens, in the same order, with the same settings, three times. The only thing that changed between the runs was the random seed that sets the starting weights. The final validation losses were 3.6681, 3.6690 and 3.6858.
That spread, 0.018 nats, is the yardstick for the rest of this series. A change to the model that moves the loss by less than that has not shown anything yet.
This is the first measurement in a series that takes GPT-2 (124M) and adds, one at a time, the changes that later training recipes made: rotary position embeddings, RMSNorm and QK-norm, ReLU², the Muon optimizer, zero-initialized projections and logit softcapping. The previous post condensed Karpathy's GPT-2 reproduction, which is where the starting model comes from. Before changing anything, though, there is a more basic question. If I train the same model twice, how far apart do the two results land? Every later comparison is only as good as that answer.
The short answer
- Across three seeds the final loss spread 0.0177 nats (standard deviation 0.0100). Three runs pin the standard deviation down only loosely: its 95% interval runs from 0.005 to 0.063.
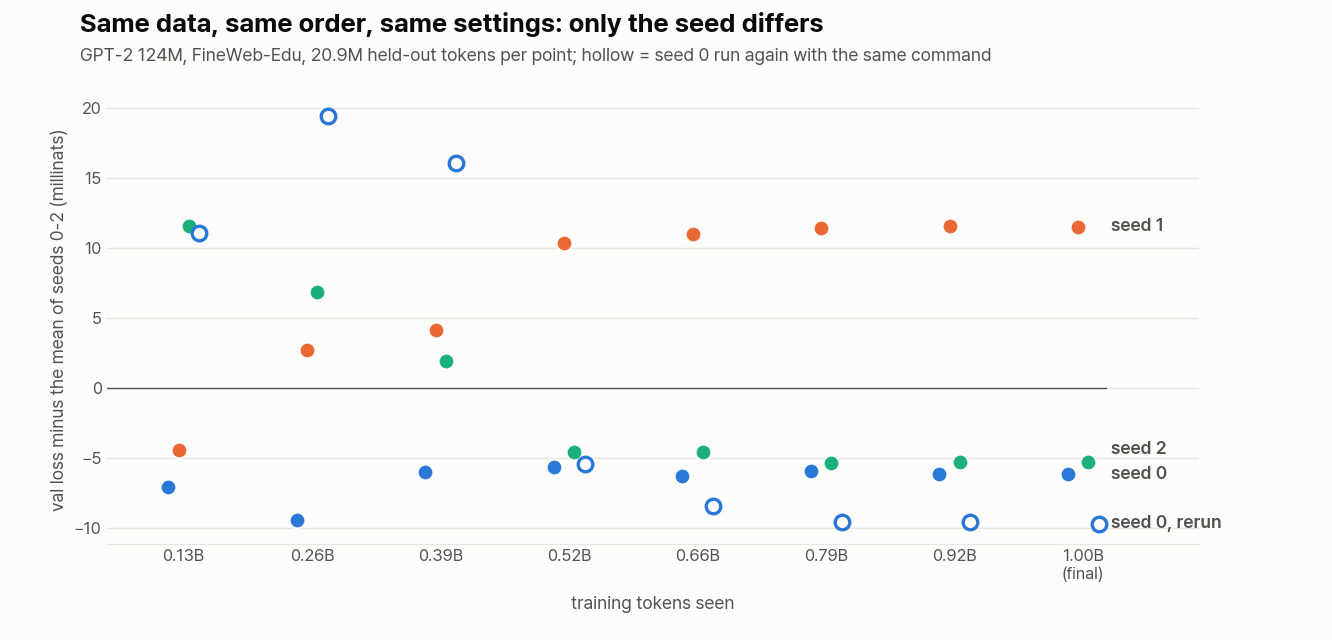
- In these runs the seed effect looked like a fixed offset more than jitter. One seed sat about 0.010 to 0.012 above the three-seed mean from half a billion tokens onward and never caught up. At the first two checkpoints, a different seed had been the worst.
- The same seed, run again with the same command, ended 0.0035 apart, about a fifth of the range across seeds (a third of their standard deviation). Early in training the two copies were up to 0.029 apart, more than the spread across seeds at that point, and then came back together.
- What this means for the series: with three seeds per configuration, a difference has to exceed 0.016 nats to count. That is the rule I fixed before the runs, and it is why every later post uses three seeds per configuration instead of two.
What I ran
The model is GPT-2 small: 12 layers, width 768, 12 heads, a 1,024-token context and tied input and output embeddings. The code is nanoGPT (commit 3adf61e, MIT licence) with one change, the tanh form of GELU that GPT-2 itself uses. Loaded with OpenAI's weights, it gives the same loss as Hugging Face's GPT-2 on the same tokens, so the starting point is GPT-2 and not something close to it.
| Setting | |
|---|---|
| Data | FineWeb-Edu shards (the ones nanochat uses), GPT-2 tokenizer, read in the same order in every run |
| Budget | 1,907 steps × 524,288 tokens = 1.0B training tokens |
| Optimizer | AdamW, β (0.9, 0.95), weight decay 0.1 on matrices, gradient clipping 1.0 |
| Learning rate | peak 6e-4, 100 warmup steps, cosine decay to 10% (GPT-2/GPT-3 values, not tuned for this budget) |
| Precision and speed | bfloat16 autocast, torch.compile, PyTorch SDPA attention |
| Hardware | two A100 80GB PCIe cards, data parallel; about 49 minutes per run |
| Validation | the same 20.9M held-out tokens for every run, every 250 steps and at the end |
Four runs, all with this exact setup:
- seeds 0, 1 and 2. The seed sets the random initial weights. Nothing else changes: same data, same order, same settings.
- seed 0 again, started with the identical command, after the other three. Same seed means the same initial weights; the harness logs a hash of the initial embedding matrix, and the analysis refuses to run if the two seed-0 runs do not match. If the result still moves, the movement comes from the GPU, not from the seed.
The second kind of run is there because GPU training is not bit-for-bit repeatable by default. The attention backward pass and the gradient all-reduce between the two cards can add numbers in a different order from one run to the next, and floating-point addition is not associative. Whether that matters at the end of a run is something to measure, not assume.
I wrote down the questions, the runs and what would count as an answer, and committed them before the first run started. The analysis script was committed before the first run finished. One run had to be restarted: the first attempt at seed 0 was killed at step 1,580 of 1,907 when my work session restarted. It has no final loss, so it is kept in the results folder and not used; the four runs below all completed from start to finish.
Final losses
| Run | Final validation loss | Minus the three-seed mean |
|---|---|---|
| seed 0 | 3.6681 | −0.0062 |
| seed 1 | 3.6858 | +0.0115 |
| seed 2 | 3.6690 | −0.0053 |
| seed 0, run again | 3.6646 | −0.0097 |
The three seeds average 3.6743 with a standard deviation of 0.0100 and a range of 0.0177. The fourth row is not a fourth seed and is not in that average; it is the next section's question.
For scale: averaged over the three seeds, the validation loss dropped by 0.0175 over the last 157 steps (82M tokens) of training, from 3.6918 to 3.6743. The gap between the best and worst seed is about what those last 8% of steps bought. That comparison leans on the learning-rate schedule, which is near its minimum at the end, so treat it as a sense of size, not an exchange rate.
For reference, OpenAI's released GPT-2 (124M) scores 3.297 on the same held-out tokens. It was trained on different data and far more tokens, so the gap says nothing about these runs except that a billion tokens is a short budget.
The same seed, run twice
Seed 0's two runs started from identical weights (the logged embedding hashes match) and saw identical data. Their validation losses at each checkpoint:
| Tokens seen | Seed 0 | Seed 0, run again | Gap |
|---|---|---|---|
| 0.13B | 5.5643 | 5.5824 | 0.0182 |
| 0.26B | 4.7051 | 4.7340 | 0.0288 |
| 0.39B | 4.1666 | 4.1887 | 0.0221 |
| 0.52B | 3.9411 | 3.9413 | 0.0002 |
| 0.66B | 3.8147 | 3.8126 | 0.0021 |
| 0.79B | 3.7329 | 3.7293 | 0.0036 |
| 0.92B | 3.6856 | 3.6822 | 0.0034 |
| 1.00B (final) | 3.6681 | 3.6646 | 0.0035 |
So the GPU alone moved the result. At 0.26B and 0.39B tokens the two copies were further apart than the three different seeds were at the same checkpoints (0.0288 against a range of 0.0163, and 0.0221 against 0.0102); at 0.13B the two gaps were about the same (0.0182 and 0.0187). By 0.5B tokens they had come back together, and they finished 0.0035 apart.
There is a third copy of seed 0 that I did not plan: the attempt that was killed at step 1,580. Its checkpoints tell the same story, 0.0085 from the completed seed 0 run at 0.26B tokens and under 0.001 at 0.52B, 0.66B and 0.79B. It is one more pair, not part of the decision rule, but it points the same way.
I did not isolate where the difference comes from. The candidates are the attention backward kernel and the order of the gradient reduction between the two cards; separating them would take runs with deterministic kernels, which are slower and are not how these runs, or most training runs, are set up.
Over the whole run
| Tokens seen | Mean of seeds 0-2 | Standard deviation | Range |
|---|---|---|---|
| 0.13B | 5.5714 | 0.0101 | 0.0187 |
| 0.26B | 4.7146 | 0.0085 | 0.0163 |
| 0.39B | 4.1726 | 0.0054 | 0.0102 |
| 0.52B | 3.9468 | 0.0090 | 0.0160 |
| 0.66B | 3.8211 | 0.0095 | 0.0173 |
| 0.79B | 3.7389 | 0.0099 | 0.0174 |
| 0.92B | 3.6918 | 0.0100 | 0.0178 |
| 1.00B | 3.6743 | 0.0100 | 0.0177 |
Two things stand out. The standard deviation across seeds did not shrink as training went on: apart from one checkpoint it stayed near 0.01. And the order changed once and then held. At the first two checkpoints seed 2 was the worst of the three; from 0.39B tokens on, seed 1 was the worst at every checkpoint, and from 0.52B on it trailed the best seed by about the same margin each time (0.016 to 0.018). Whatever seed 1 started with, the rest of the run did not wash it out within a billion tokens.
What this means for the rest of the series
Before the runs I fixed one rule for every later comparison: run n seeds of each configuration, and call two configurations different only if their mean losses differ by more than 2 × σ × √(2/n), where σ is the seed standard deviation. With σ = 0.0100:
| Seeds per configuration | Smallest difference that counts |
|---|---|
| 2 | 0.0199 |
| 3 | 0.0163 |
I also fixed which of the two to use: two seeds if 2σ came out at 0.01 nats or less, three otherwise. It came out at 0.0199, so every later post runs three seeds per configuration. At 49 minutes a run, that is about two and a half hours of GPU time per configuration.
σ will not stay at 0.0100. Each later post adds three runs per configuration, and the rule pools the seed variance from all of them, so the estimate tightens as the series goes on. If it ends up higher than 0.0100, the bar rises with it, and some differences I would call real today would not count.
A difference smaller than the bar will be reported as "not distinguishable at this budget", never as "the same". Three seeds can miss a real effect of 0.01 nats; they just cannot confirm one.
What this does not show
- Data order was fixed. Every run read the same tokens in the same order, because every comparison in this series does. If you shuffle the data differently in each run, as most training setups do, expect the spread to be at least this large and probably larger. I did not measure it.
- One model size, one budget. GPT-2 small at one billion tokens. A longer run might wash out seed 1's offset, or not.
- Three seeds estimate the standard deviation loosely. The 95% interval runs from 0.005 to 0.063. The rule uses the point estimate.
- The rule is a rough two-standard-error test. With this few runs a t-test would set a higher bar. I fixed the simpler rule in advance and keep it, so the series stays comparable, but it leans toward calling things different.
- The GPU-only difference is specific to this setup: PyTorch 2.8, SDPA attention, two A100 PCIe cards with data parallelism. Other kernels, another GPU count or deterministic mode would give a different number.
The plan, the scripts and the raw logs of all four runs (and of the killed attempt) are in this series' free code download (log in to download; it includes a notebook that reproduces every number and the figure here from the raw logs), with the commit times that show the order: plan, then runs, then analysis.
Reproduction package
The harness, raw logs and result CSVs behind this post. No account needed; the README has a command that recomputes the tables without a GPU.
gpt2-noise-floor-repro.zip · 132 KB
Subscribe to Newsletter
Related Posts

Inside Karpathy's autoresearch — Building an AI Research Lab in 630 Lines
A code-level deep dive into Karpathy's autoresearch. Dissecting train.py, BPE tokenizer, MuonAdamW optimizer, and the agent protocol design.
Karpathy's microgpt.py Dissected: Understanding GPT's Essence in 150 Lines
A line-by-line dissection of microgpt.py -- a pure Python GPT implementation with zero dependencies. Training, inference, and autograd in 150 lines.

VibeTensor: Can AI Build a Deep Learning Framework from Scratch?
NVIDIA researchers released VibeTensor, a complete deep learning runtime generated by LLM-based AI agents. With over 60,000 lines of C++/CUDA code written by AI, we analyze the possibilities and limitations this project reveals.