Which Mistakes Are Expensive? One Routing System Re-scored at Seven Prices for a Wrong Answer
Re-scoring 3,080 BANKING77 messages: the price of a wrong answer moved the threshold far more than the choice of model, and decision models paid only when a wrong answer cost two hand-offs or less.

Which Mistakes Are Expensive? One Routing System Re-scored at Seven Prices for a Wrong Answer
The routing system in the last post answers a bank customer's message automatically when it is sure and hands the rest to a person. Its thresholds were chosen for an accuracy target: 95% or 98% of automatic answers correct. That post ended on what it did not measure: what a wrong answer costs compared with a person's time.
This post adds that cost. No new model runs. I re-scored the same results (a classifier and eight classifier-plus-decision-model systems, on 1,003 validation and 3,080 test messages of BANKING77) under cost tables written down before scoring.
The cost of one message
Every message ends one of three ways, and each has a cost in units of one hand-off:
- answered automatically and right: 0
- handed to a person: 1
- answered automatically and wrong: r
r is how many hand-offs one wrong answer is worth. A wrong answer about card delivery might cost little more than a hand-off; telling someone with a stolen card how to change their PIN costs much more. Nobody knows their r exactly, so I scored at r from 1 to 100 and looked for where the decisions change.
Since a single cost table can be chosen to make any system win, I wrote four into the series plan before writing the scoring script (the setup note at the end says what that rests on):
- Uniform: every wrong answer costs r.
- At risk: 11 intents where the customer's money or account is at risk right now (a lost or stolen card, a compromised card, a payment or withdrawal not recognised, a transfer that never arrived, a request to cancel a transfer, and five more) cost 5r when answered wrongly.
- Same team: the 77 intents are split among eight teams that would handle them (card delivery, card problems, card payments, cash, top-ups, transfers, exchange, account). A wrong answer that stays inside the right team costs 0.2r, because a colleague passes it along.
- Both: at-risk first, then same-team.
For each scenario, each r and each system, the thresholds were chosen on validation to give the lowest average cost, and the test set was scored with them. The A1 accuracy-target thresholds were scored under the same costs for comparison.
The short answer
- The price of a wrong answer changed how much the system answers far more than which model it used. With the classifier alone, the thresholds chosen for each price answered 99.0% of test messages automatically at r = 1, 82.5% at r = 5, 74.3% at r = 20 and 57.9% at r = 50.
- An accuracy target fixes a price without saying so. The 95% and 98% settings from the last post cost the same at r = 5.37. At r = 20 the 95% setting cost twice as much as the threshold chosen for that price.
- The decision models paid only when a wrong answer was cheap. In all four scenarios some of them beat the classifier alone at r = 1 and r = 2, by at most 14 hand-offs per 1,000 messages. From r = 5 none did.
- The name of the cheapest system changed 9 to 19 times along the range of r, mostly between systems whose costs could not be told apart.
The price moves the threshold
With the classifier alone and the uniform cost, here is what the threshold chosen on validation did on test, and what the two accuracy-target settings from the last post cost at the same price.
| r (one wrong answer = r hand-offs) | Answered automatically | Correct among those | Wrong | To a person | Cost per 1,000 messages | 95% target setting | 98% target setting |
|---|---|---|---|---|---|---|---|
| 1 | 99.0% | 93.5% | 197 | 31 | 74 | 103 | 187 |
| 2 | 94.4% | 95.8% | 123 | 174 | 136 | 139 | 203 |
| 5 | 82.5% | 98.1% | 48 | 538 | 253 | 245 | 252 |
| 10 | 80.2% | 98.4% | 39 | 611 | 325 | 422 | 333 |
| 20 | 74.3% | 99.1% | 21 | 793 | 394 | 776 | 495 |
| 50 | 57.9% | 99.4% | 10 | 1,296 | 583 | 1,837 | 982 |
| 100 | 57.9% | 99.4% | 10 | 1,296 | 745 | 3,607 | 1,794 |
Cost per 1,000 messages is (wrong × r + to a person) ÷ 3,080 × 1,000. Between r = 1 and r = 50 the share answered automatically fell by 41 points. At any single r, the nine systems' automatic shares were at most 4.0 points apart in this scenario (at most 10.6 points in the others, with both adjustments at r = 20, where Tev1 with five candidates was still in use).
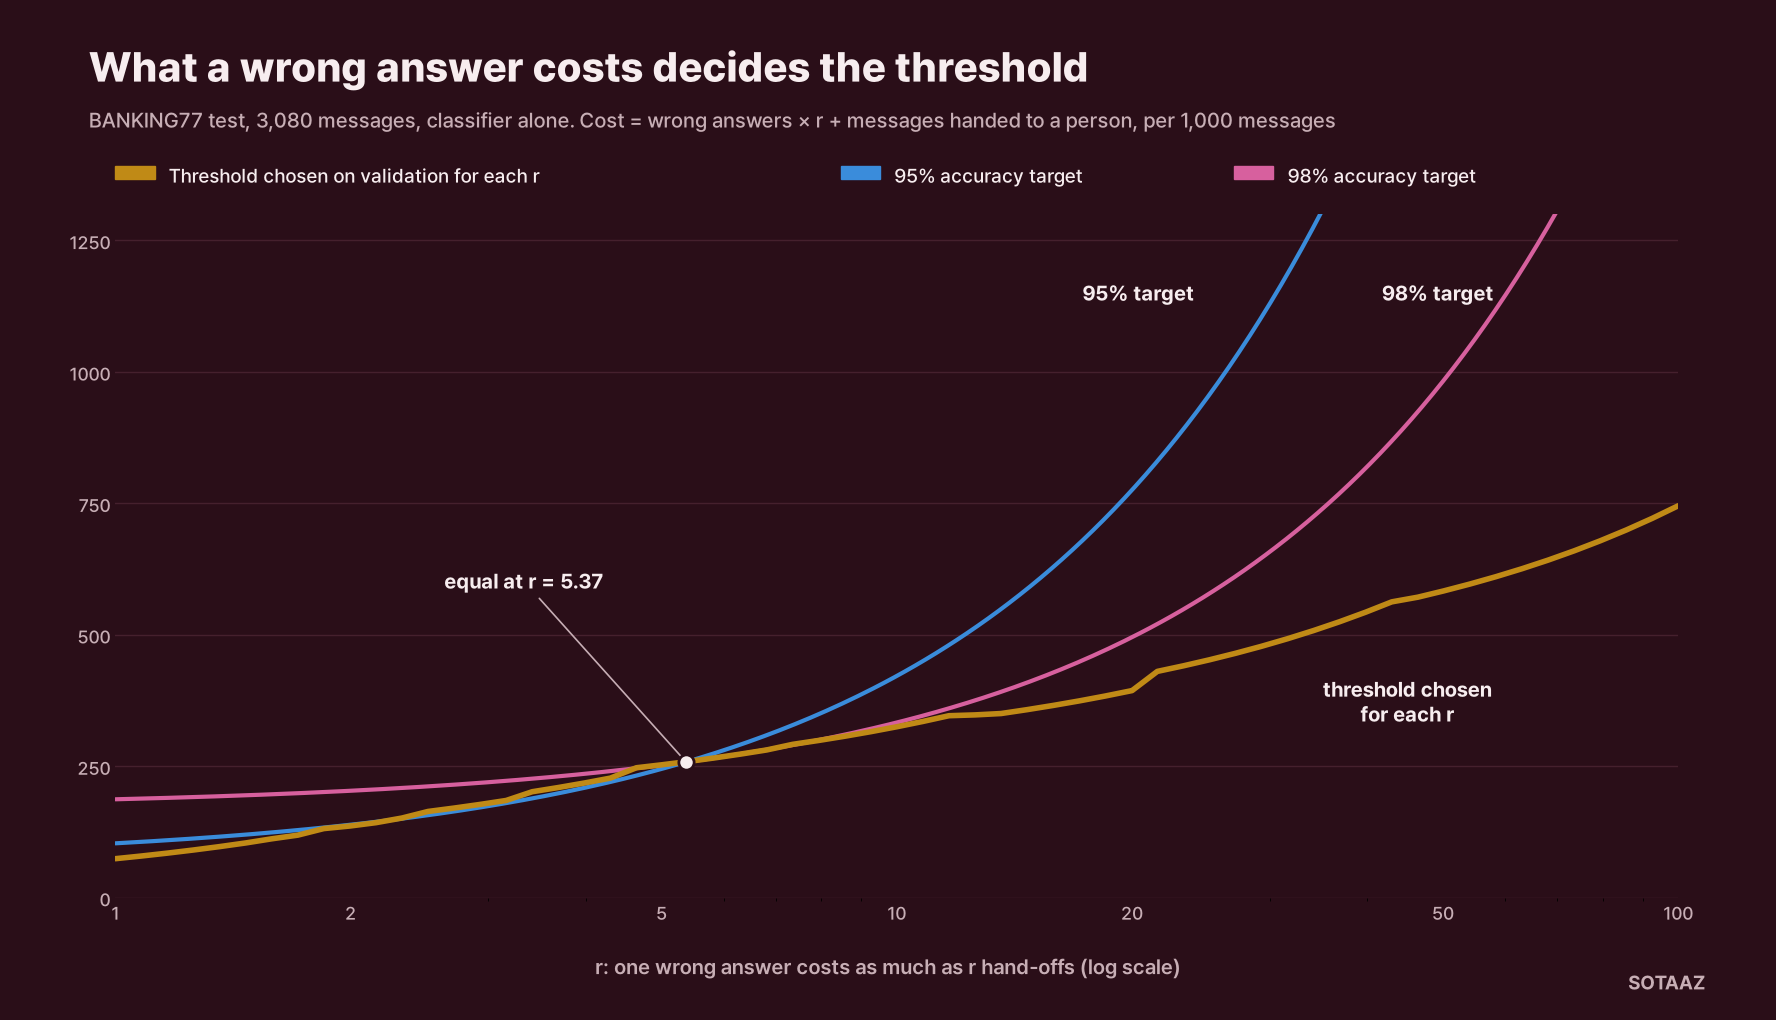
The accuracy targets are each close to the best only in a narrow band. At r = 2 and r = 5 the 95% setting was as cheap as the threshold chosen for that price (differences of −2 and +8 per 1,000, paired bootstrap intervals −6 to +1 and −14 to +30). At r = 20 the threshold chosen for the price saved 382 hand-offs per 1,000 messages against the 95% setting (271 to 492).
Two settings, one break-even point
You do not need the full table to see where a choice flips. The two settings from the last post, on the same 3,080 test messages:
- 95% target: 109 wrong, 209 to a person
- 98% target: 50 wrong, 526 to a person
Their costs are 109r + 209 and 50r + 526. They are equal when r = (526 − 209) ÷ (109 − 50) = 5.37. If a wrong answer costs more than about five hand-offs, the stricter setting is cheaper; below that, the looser one is. Choosing "95%" was choosing r below 5.37 without writing it down.
Decision models paid only when mistakes were cheap
The last post found that on BANKING77 the decision models (Nimble 9B and Tev1 4B through Ollama, Jev 1.13 through its API) took no work off the person at the 95% and 98% targets. With cost-chosen thresholds, they did at low r.
In the uniform scenario, at r = 1 three systems cost less than the classifier alone (Nimble with five candidates by 5.8 hand-offs per 1,000, interval 0.6 to 11.4; Tev1 with five and with ten). At r = 2 all three Nimble settings did, the largest by 10.4 per 1,000 (5.5 to 14.9), on a base of 136. At r = 5 none was distinguishable from the classifier, and from r = 10 validation chose to accept no second-stage answer at all for any model. The last r at which validation still let a second stage answer anything was between 2.15 and 5.84, depending on the system.
The other scenarios followed the same shape. Some systems were cheaper at r = 1 and r = 2 (between one and six of the eight, depending on the scenario and r), the largest saving was 14.2 per 1,000 (both, r = 2, Nimble with 20 candidates, 10.1 to 18.7), and none was cheaper at r = 5 or 10. With same-team discounts most systems kept the second stage in use for longer than with the uniform cost, up to r = 5.84 to 10.80, since many wrong answers stay inside a team. The longest of all was Tev1 with five candidates: up to r = 34 with same-team discounts and up to r = 68 with both adjustments. Tev1 lists BANKING77 among its training data.
The reason is arithmetic. Answering a handed-on message is cheaper than handing it on only if the answer is right more than 1 − 1/r of the time: 50% at r = 2, 80% at r = 5, 90% at r = 10. On the messages the classifier handed on at the r = 5 threshold, the models' most confident answers (probability 0.99 or more) were right this often:
| Answers with probability ≥ 0.99 on handed-on messages | Validation | Test |
|---|---|---|
| Nimble, top 5 / 10 / 20 | 77% / 78% / 82% (23/30, 21/27, 23/28) | 89% / 88% / 85% |
| Tev1, top 5 / 10 | 83% / 59% (5/6, 10/17) | 80% / 75% |
| Jev, top 5 / 10 / all 77 | 57% / 59% / 64% (36/63, 29/49, 29/45) | 78% / 79% / 80% |
On validation only Nimble with 20 candidates (23 of 28) and Tev1 with five (5 of 6) cleared 80%, and those two were the only systems still answering anything at r = 5, at a cost that could not be told apart from the classifier alone. On test, all three Nimble settings and Jev with all 77 options cleared 80%, so with more validation data some of these cascades might have paid a little at r = 5. The handed-on validation messages were harder than the test ones across the board (the classifier's own first choice was right on 60% of them against 68% on test), and the samples are small.
The cheapest system changed often, and mostly by noise
Along the 65 values of r I scored, the name of the cheapest system changed 9 times in the uniform scenario, 11 with at-risk intents, 19 with same-team discounts and 15 with both. The differences behind those changes were small. At r = 1 the cheapest system and the runner-up could not be told apart in any scenario, and at r = 2 the cheapest beat the runner-up by 2.3 to 4.2 hand-offs per 1,000 messages. A ranking of models at one price is not a finding. Whether the second stage is used at all, and where the classifier's threshold sits, is.
When validation chose worse
Choosing thresholds for a cost on validation did not always beat the accuracy target on test. With at-risk intents at r = 2 it cost 15.9 more per 1,000 than the 95% setting (2.9 to 26.6), and with both adjustments at r = 2, 22.1 more (9.4 to 32.5). Validation has 1,003 messages, between 4 and 19 per intent; the 11 at-risk intents have 155 together, between 6 and 18 each.
High prices hit a second limit. At r = 50 and r = 100 the search landed on the same threshold (0.976), because above it validation had 553 answers and 2 wrong ones. Two errors cannot tell a 0.4% error rate from a 1% one, and at r = 100 that is the whole question. The more a wrong answer costs, the more validation messages you need to set the threshold for it.
The mix-ups
Over all 3,080 test messages, the classifier's first choice was wrong 219 times. 137 of those (63%) stayed inside the right team, and 42 were messages whose intent is at risk.
| Classifier mix-up on test (both directions) | Times | Same team | Involves an at-risk intent |
|---|---|---|---|
| card_arrival / card_delivery_estimate | 7 | yes | no |
| verify_my_identity / why_verify_identity | 6 | yes | no |
| exchange_via_app / fiat_currency_support | 5 | yes | no |
| card_payment_not_recognised / compromised_card | 5 | no | yes |
| card_payment_not_recognised / direct_debit_payment_not_recognised | 5 | yes | yes |
| declined_card_payment / declined_transfer | 5 | no | no |
| balance_not_updated_after_bank_transfer / pending_transfer | 5 | yes | no |
| balance_not_updated_after_bank_transfer / transfer_not_received_by_recipient | 4 | yes | yes |
The last column says whether either intent of the pair is at risk. The at-risk cost applies only in the direction where the true intent is the at-risk one.
The most frequent mix-up is cheap: "When will I get my card?" is labelled card arrival and was answered as a card delivery estimate, which stays with the same people. The fourth one is not. "There are some strange charges on my card that I didn't make... Is my card stolen and if so should I cancel it?" is labelled a payment not recognised and was answered as a compromised card. The two are handled by different teams, and a person reading it might hesitate too.
Can you find these pairs before you have a model? I compared each intent's average training message (TF-IDF over words and characters, training data only) and ranked all 2,926 pairs by similarity. The 77 most alike pairs (2.6% of all pairs) covered 116 of the 219 errors (53%), and the 30 most alike covered 55 (25%). The identity pair ranked first. The pair card_payment_not_recognised / compromised_card ranked 177th. A list from the text alone is a reasonable start, and the expensive mix-up is the kind it misses.
A checklist for the evaluation set
- Enough messages per intent to measure what you care about. If an intent is answered right 90% of the time, the 95% interval is 34 points wide on 13 messages, 19 points on 40 and 6 points on 400. BANKING77's test set has 40 per intent; my validation split has 4 to 19.
- Enough of the expensive intents. The 11 at-risk intents have 440 test messages together, but only 6 to 18 each in validation.
- Enough errors to set a strict threshold. At r = 50, 2 validation errors decided the threshold.
- Questions outside your intents. BANKING77 has none; the last post showed on CLINC150 what happens to thresholds without them.
- Write the cost table before you score. Which intents are at risk, which teams handle what, and the range of r.
What to do with this
- Ask what a wrong answer costs in hand-offs, even roughly. "Between 5 and 20" is enough to rule out the 95% setting here.
- Score at more than one price. If the decision flips inside the range you believe, report the range, not the winner.
- Test a second-stage model on the price you have. At a low price it can save some work; at five hand-offs or more it saved nothing measurable here.
- Spend labels where the cost is. More validation messages on the at-risk intents would have done more for these thresholds than another model.
What this does not show
One dataset, one classifier, the same model versions as the last post, and cost tables I wrote myself: the 11 at-risk intents, the eight teams, the 5× and 0.2× weights. Another bank would draw them differently. The test set was already scored in the last post; every choice here was made on validation, but the reader should know the test set is not fresh. Stage-2 latency and API cost are left out of the cost (both are in the last post). Thresholds for the second stage were searched in steps of 0.01, and Jev's probabilities come rounded to two decimals. Tev1 lists BANKING77 among its training data.
I'm writing a book that builds this system step by step
One example from start to finish on BANKING77: a fixed split, a classifier, decision models, handing off what it doesn't know, and running it. Chapters 1 and 2 are free to read. Leave your email and I'll tell you once, when it's out.
Setup: results from the previous post (classifier sentence-transformers/all-MiniLM-L6-v2 + logistic regression, temperature-scaled; second stage Nimble 9B and Tev1 4B on Ollama 0.35.0, Jev 1.13 through its API; BANKING77 split 9,000 / 1,003 / 3,080, seed 20261001). Cost: 0 for a right automatic answer, 1 for a hand-off, r × severity for a wrong automatic answer; severity 5 for the 11 at-risk intents, 0.2 inside the same team, otherwise 1, written into the series plan (docs/decision-system-plan.md) before the scoring script was written. My working log shows that order; the repository does not, because the plan was committed later together with the results. Two things were settled in the code rather than the plan: during the run I added the seven reported values to the grid of r, and before the first run I set ties in the second threshold to go to the higher one. r on a log grid of 61 points from 1 to 100 plus 1, 2, 5, 10, 20, 50 and 100. Thresholds: t1 over every distinct validation probability, t2 from 0 to 1 in steps of 0.01, lowest mean validation cost, ties to the higher threshold. Differences are paired bootstrap intervals over the 3,080 test messages (2,000 resamples, seed 20261001). Pair similarity: cosine between per-intent mean TF-IDF vectors (word 1-2 grams and character 2-5 grams, sublinear tf) on the training split. Scripts: scripts/jev-bench/cost_scenarios.py, scripts/jev-bench/confusion_vs_text.py; results: drafts/jev-bench/results/cost-banking77.json, confusion-vs-text-banking77.json. Run 2026-10-04.
Courses that go with this post
SOTAAZ courseCourses are sold one at a time. If you want all 13, there is a $199 lifetime bundle.
Subscribe to Newsletter
Related Posts
Classifier, LLM or Decision Model? A Measured Guide to Text Classification
One path through every text-classification measurement on this blog: on the same 154 banking messages, a CPU classifier scored 90.3%, an LLM with five retrieved examples 94.8%, and Jev 76.0%. Which to use, and when.

What Are You Deciding, and Which Mistakes Are Expensive? Chapter 1 of a Book on Building Decision Systems
Free chapter: before training anything, count what each intent can tell you, find the intents likely to be confused, and write down what each mistake costs. The code runs in under a second.

How Far Does a Simple Classifier Get? Chapter 2 of a Book on Building Decision Systems
Free sample chapter: split BANKING77 before training, then two CPU classifiers reach 91.2% and 92.9% on the test set, with code that runs in about a minute.