Can an 8 GB GPU Turn One Photo Into a 3D Model? Idol Peaked at 7,380 MiB on a Capped A100
We ran Speridlabs' Idol on an A100 capped at 8 GB, with no real 8 GB card. A real photo peaked at 7,380 MiB in nvidia-smi: 300 MiB left counting 8,192 MiB with a 512 MiB desktop, 263 MiB over counting 8 × 10⁹ bytes. Commands and the step that adds 762 MiB.
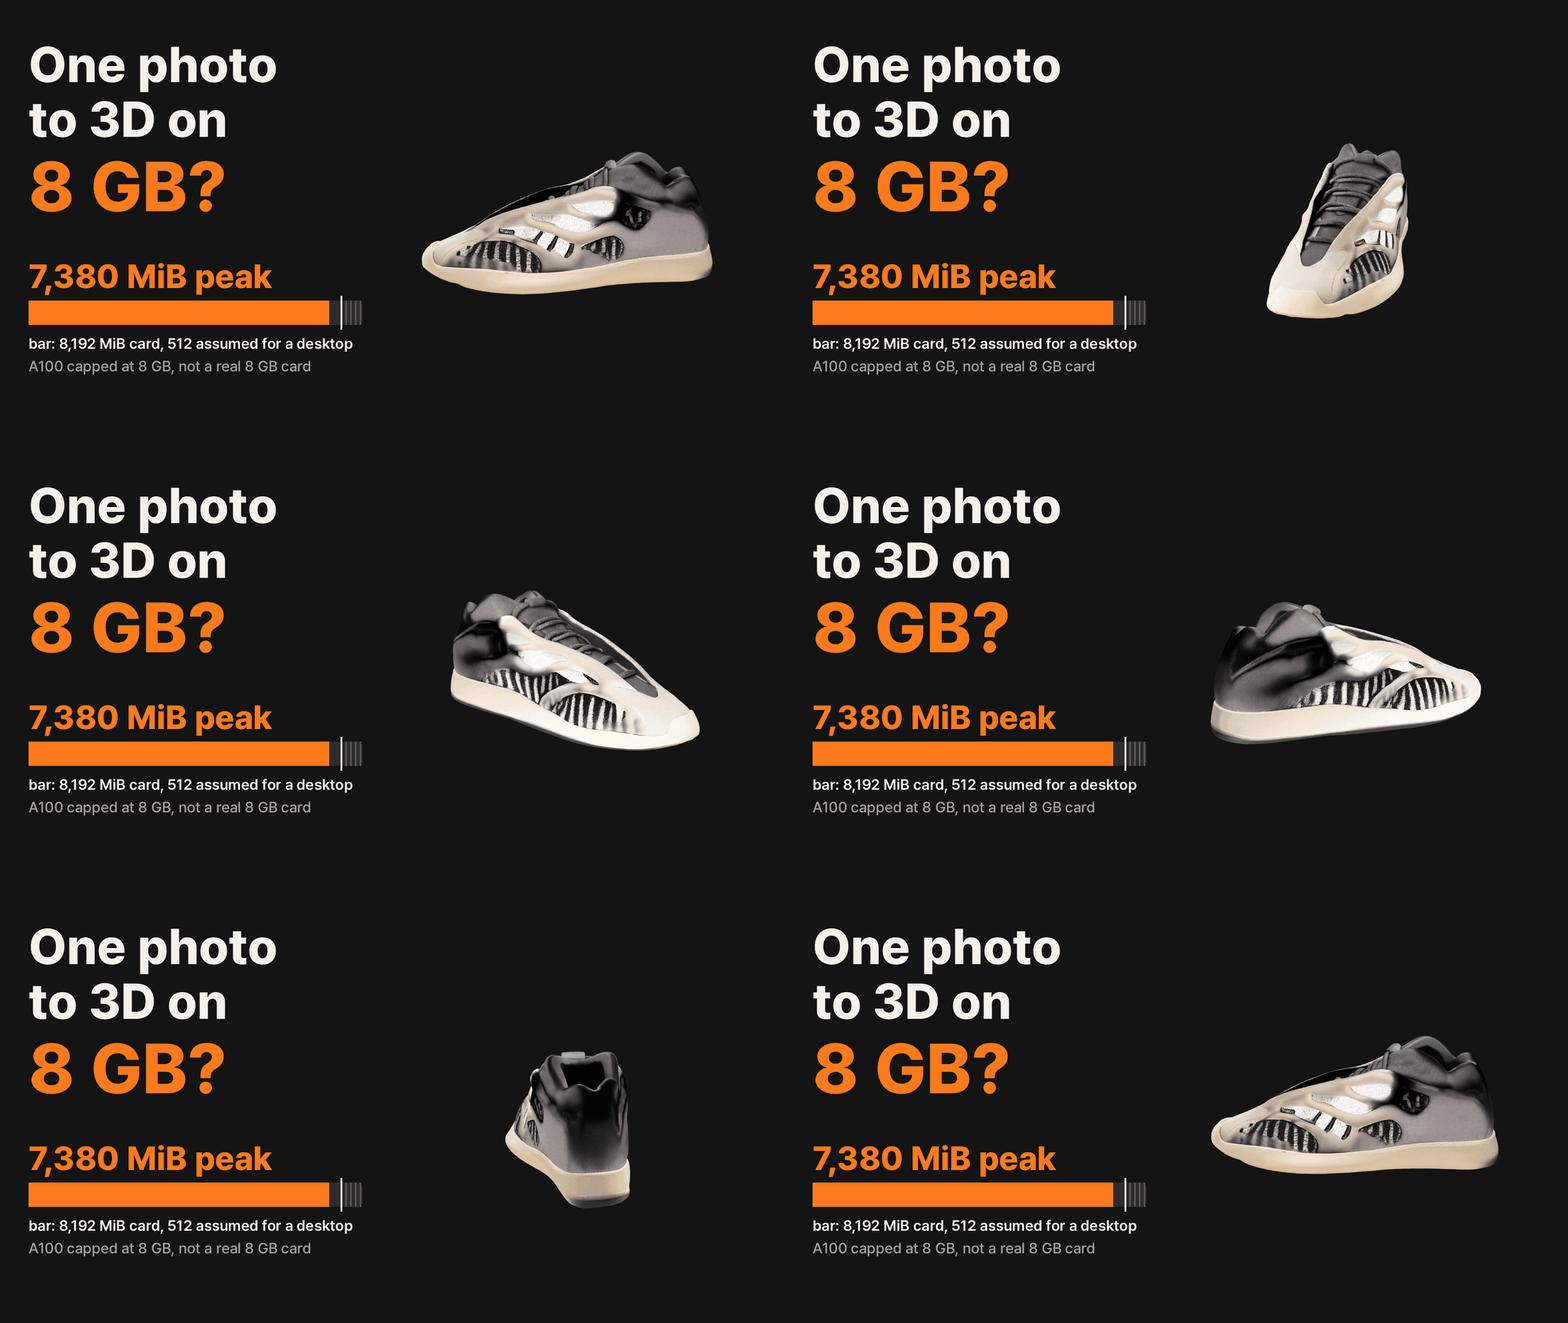
Can an 8 GB GPU Turn One Photo Into a 3D Model? Idol Peaked at 7,380 MiB on a Capped A100
Idol's README says it runs "using 7.2 GB of VRAM". Our first test said 6,618 MiB.
The mistake was in our test images. We had used the preview images from Idol's README, and those already have transparent backgrounds, so Idol's background removal never ran. A normal photo has a background. With real photos the peak was 7,380 MiB as nvidia-smi counts it, which is 7.21 GiB. When we cut those same photos out beforehand and ran them again, the peak fell back to 6,616.
So does it fit an 8 GB card? We don't have one, so we limited how much memory PyTorch could use on an A100 to an 8 GB card's worth. Idol runs its image encoder (DINOv3) at bf16 precision by default, and that default finished every run under those limits. If an 8 GB card has 8,192 MiB, that leaves 812 MiB with no monitor attached and 300 MiB if a desktop takes 512 MiB, which is our assumption. If it has only 8 × 10⁹ bytes, the stricter count from an earlier post, 7,380 is 263 MiB over beside that desktop. One setting, the fp32 image encoder, passes the 7,680 MiB left after a 512 MiB desktop even on the first count.
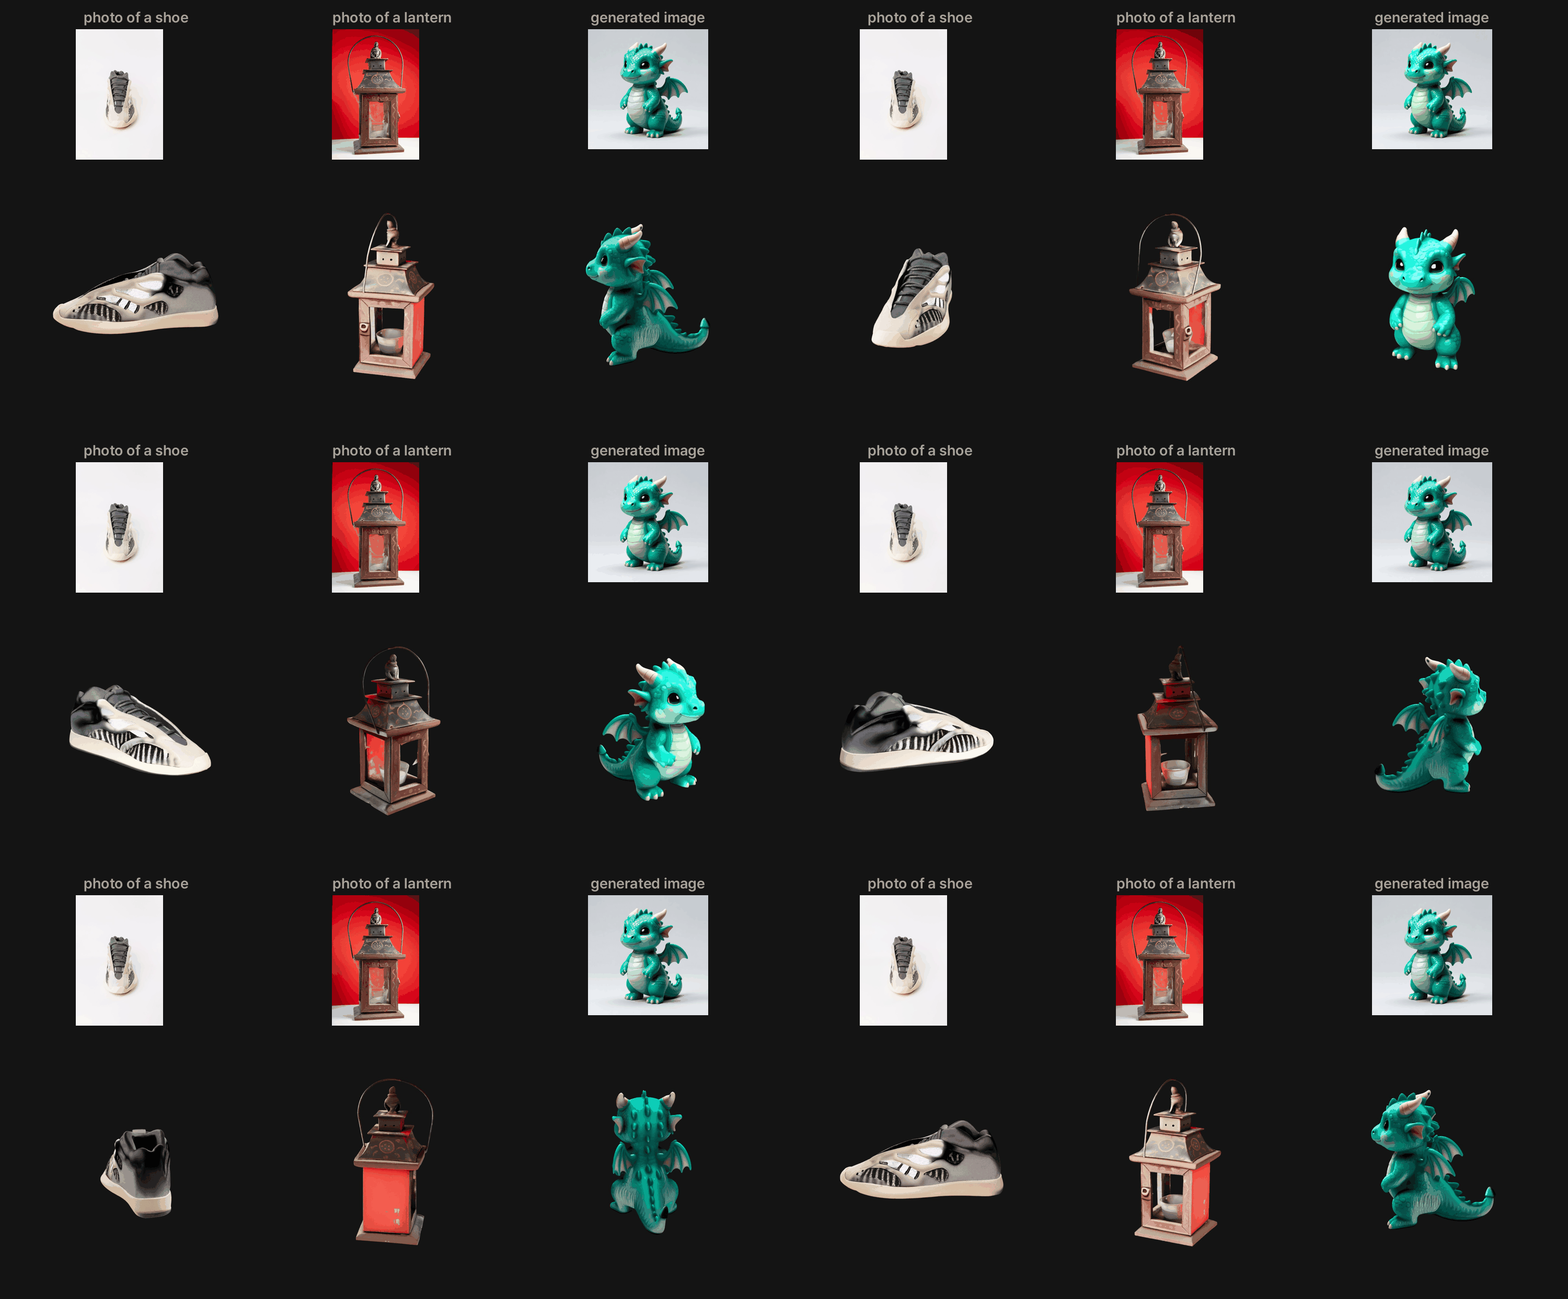
The sides you can't see in the input are made up by the model. We did not score how close they are to the real objects.
The shoe and lantern are Pexels stock photos; we generated the dragon image ourselves.
What you need
- An NVIDIA GPU with 8 GB or more. See the limits below: we never ran on a real 8 GB card.
- Python 3.10 or newer (we used 3.11) and a PyTorch build that matches your driver.
- A Hugging Face account with access to two gated repos: facebook/dinov3-vith16plus-pretrain-lvd1689m and black-forest-labs/FLUX.2-dev. From FLUX.2-dev, Idol only downloads the VAE.
About licenses: the Idol model page lists Apache-2.0 and the BiRefNet page lists MIT. DINOv3 has its own DINOv3 License. The FLUX.2-dev page says "This model falls under the FLUX Non-Commercial License" and gives no separate license for the VAE. If you plan commercial use, read those terms yourself. Access to the two gated repos is requested on their pages and may not be instant.
Step 1: install
git clone https://github.com/speridlabs/idol-sdk
cd idol-sdk
git checkout 4702a7f
python3 -m venv .venv
. .venv/bin/activate
pip install torch==2.11.0 torchvision==0.26.0 --index-url https://download.pytorch.org/whl/cu128
pip install -e . diffusers==0.42.1 transformers==5.22.1
hf auth login
We installed torch first because the default build, 2.15 for CUDA 13.2, did not match our driver (580.178.04, CUDA 13.0). nvidia-smi prints your driver's CUDA version in its top line; pick a torch build that is not newer than that. The block pins the SDK commit and the main versions we measured with. We installed with uv and did not run this pip version of the commands.
Step 2: make one object
python -m idol.sample --image photo.jpg --mode real --out outputsUse --mode real for photographs and leave out --mode (the default is synthetic) for rendered or generated images. Each image writes three files: photo.ply, photo_input.png (what the model saw) and photo_camera.json.
We ran this exact command on the shoe photo: 37.2 seconds in total with the weights already downloaded, and a 17.8 MB .ply. The README says any Gaussian splat viewer opens the .ply. We rendered ours with our own gsplat script and had to treat the file's Y axis as pointing down, so if your object appears upside down, flip it.
To see your own peak while it runs, keep this in a second terminal:
nvidia-smi --query-gpu=memory.used --format=csv -lms 200This samples every 0.2 seconds, because one-second sampling can miss the peak. On our A100, with nothing else running, the whole card peaked at 7,390 MiB.
How much memory it took
We ran the bf16 settings first with no limit and then under two limits that stand in for an 8 GB card; fp32 ran only under the limits. PyTorch's set_per_process_memory_fraction holds its memory to 7,700 MiB for a card with no monitor, which is 8,192 minus the 492 MiB nvidia-smi showed beyond PyTorch after loading. For a card with a desktop it holds it to 7,188 MiB, which takes off 512 more. The 7,680 line below is 8,192 minus 512.
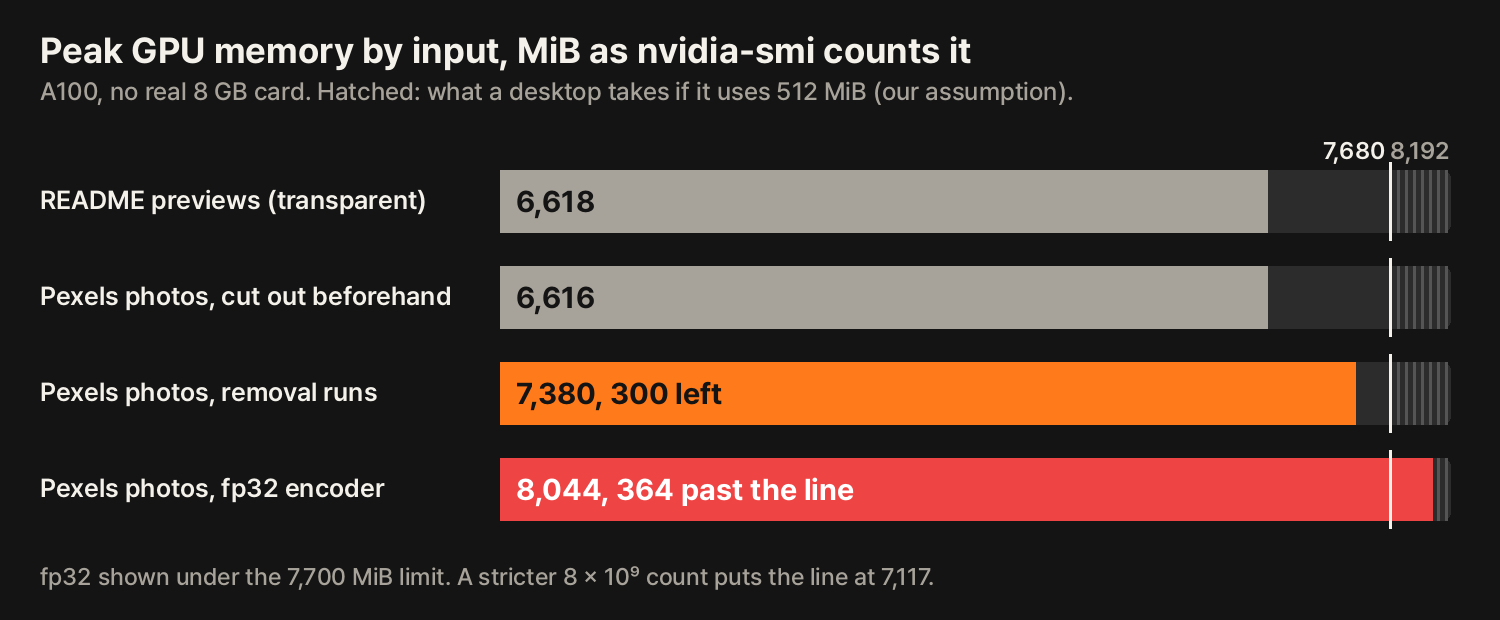
The table has three counters. Allocated is what PyTorch's tensors held at most. Reserved is what PyTorch had taken from the driver, including freed blocks it kept. nvidia-smi is what the driver reports for the whole process, and it is the one to compare with a card's size.
| Input and setting | PyTorch allocated | PyTorch reserved | nvidia-smi |
|---|---|---|---|
| README preview images, already transparent | 5,117 | 6,096 | 6,618 |
| Pexels photos, cut out beforehand | 5,117 | 6,096 | 6,616 |
| Pexels photos, background removal runs | 5,119 | 6,858 | 7,380 |
| Pexels photos, fp32 image encoder, 7,700 limit | 6,820 | 7,520 | 8,044 |
All values are peaks in MiB at the default 262,144 Gaussians. The first three rows ran with no limit. The preview images and the photos then ran under both limits with the same peaks, because bf16's reserved peak never reached either limit. The cut-out row ran only with no limit.
Which 8 GB you count changes the answer. We use 8,192 MiB here, like our last post in this series, which also takes off a 16 MiB margin (7,664); we could not read memory.total on a real card. Earlier posts counted 8 × 10⁹ bytes, which is 7,629 MiB, or 7,117 after a 512 MiB desktop. On that stricter count, photos at 7,380 are 263 MiB over beside a desktop and leave 249 MiB without one. Our 7,188 limit is above 7,117, so we did not test a limit that strict. Your own number comes from nvidia-smi --query-gpu=memory.free --format=csv.
The 7.2 can be read two ways. 7,380 MiB is 7.21 GiB. PyTorch reserved, 6,858 MiB, is 7.19 GB in decimal. Both read as 7.2, and the README doesn't say which counter or which settings it means, so we can't tell which one it is.
At bf16, a cut-out input peaked lower (two photos, no limit). If your image already has real transparency, background removal doesn't run and the peak is 6,616 MiB. That leaves 1,064 MiB beside a 512 MiB desktop, or 501 MiB on the stricter count. The removal model's weights are still loaded either way. We made our cut-outs with Idol's own removal model in a separate process, and we did not measure that step's memory, run fp32 on cut-outs or compare the resulting 3D objects.
fp32 passes the 7,680 line on photos. --dinov3_dtype fp32 runs the image encoder in full precision, which the README says takes 1.7 GB more memory. Peak allocated did rise 1,701 MiB on photos, but nvidia-smi rose only 664 MiB, which reads as PyTorch reusing memory it already held; we did not trace it. Under the 7,700 limit that is 8,044 MiB, 148 below 8,192. The README's preview images reached 8,124 on the first request (68 below 8,192, then 7,570). Under the 7,188 limit, photos reached 7,686, 6 past the line, then 7,564; the preview images reached 7,650 on the first two requests, then 7,488. All of them finished. The limit holds PyTorch's memory, not the CUDA context, so this doesn't tell us whether a real card would fail. We have no fp32 run without a limit, and we did not measure whether fp32 changes the result. With that little room, we would not run it on an 8 GB card that is also driving a desktop.
Where the 7,380 MiB goes
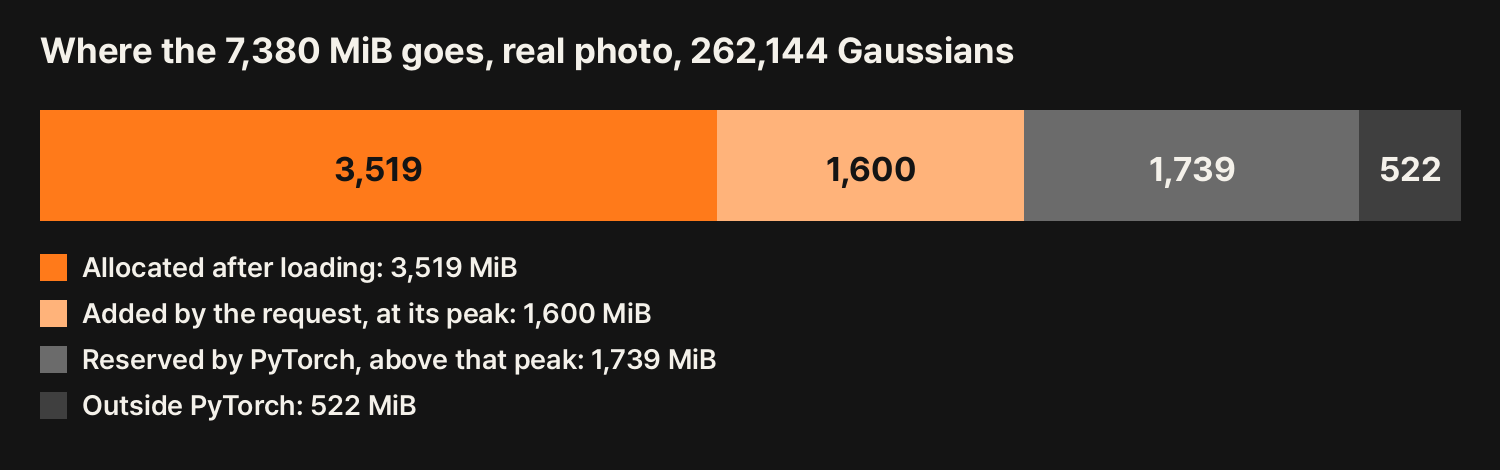
The four pieces come from the counters on the photo runs. They are differences between peak counters, not one snapshot, so the moments may differ. A request here means turning one image into one object.
- 3,519 MiB allocated after loading. All six parts of the model stay on the GPU for the whole request. There is no offload or low-VRAM flag. The README lists the weights at 3.7 to 4.4 GB.
- 1,600 MiB more at the request's busiest moment, which brings allocated to 5,119.
- 1,739 MiB reserved above that. PyTorch keeps freed blocks rather than returning them. This is the piece background removal changes: reserved goes up 762 MiB while allocated moves 2 MiB. A limit below 7,188 MiB might squeeze it, but we did not test that.
- 522 MiB outside PyTorch. This is what nvidia-smi counts beyond PyTorch's reserved memory. It includes the CUDA context; we did not break it down, and it can differ on another GPU.
More Gaussians don't raise the peak
A Gaussian is one of the small colored blobs the object is made of. --num_gaussians takes 32,768 to 1,048,576, in multiples of 32.
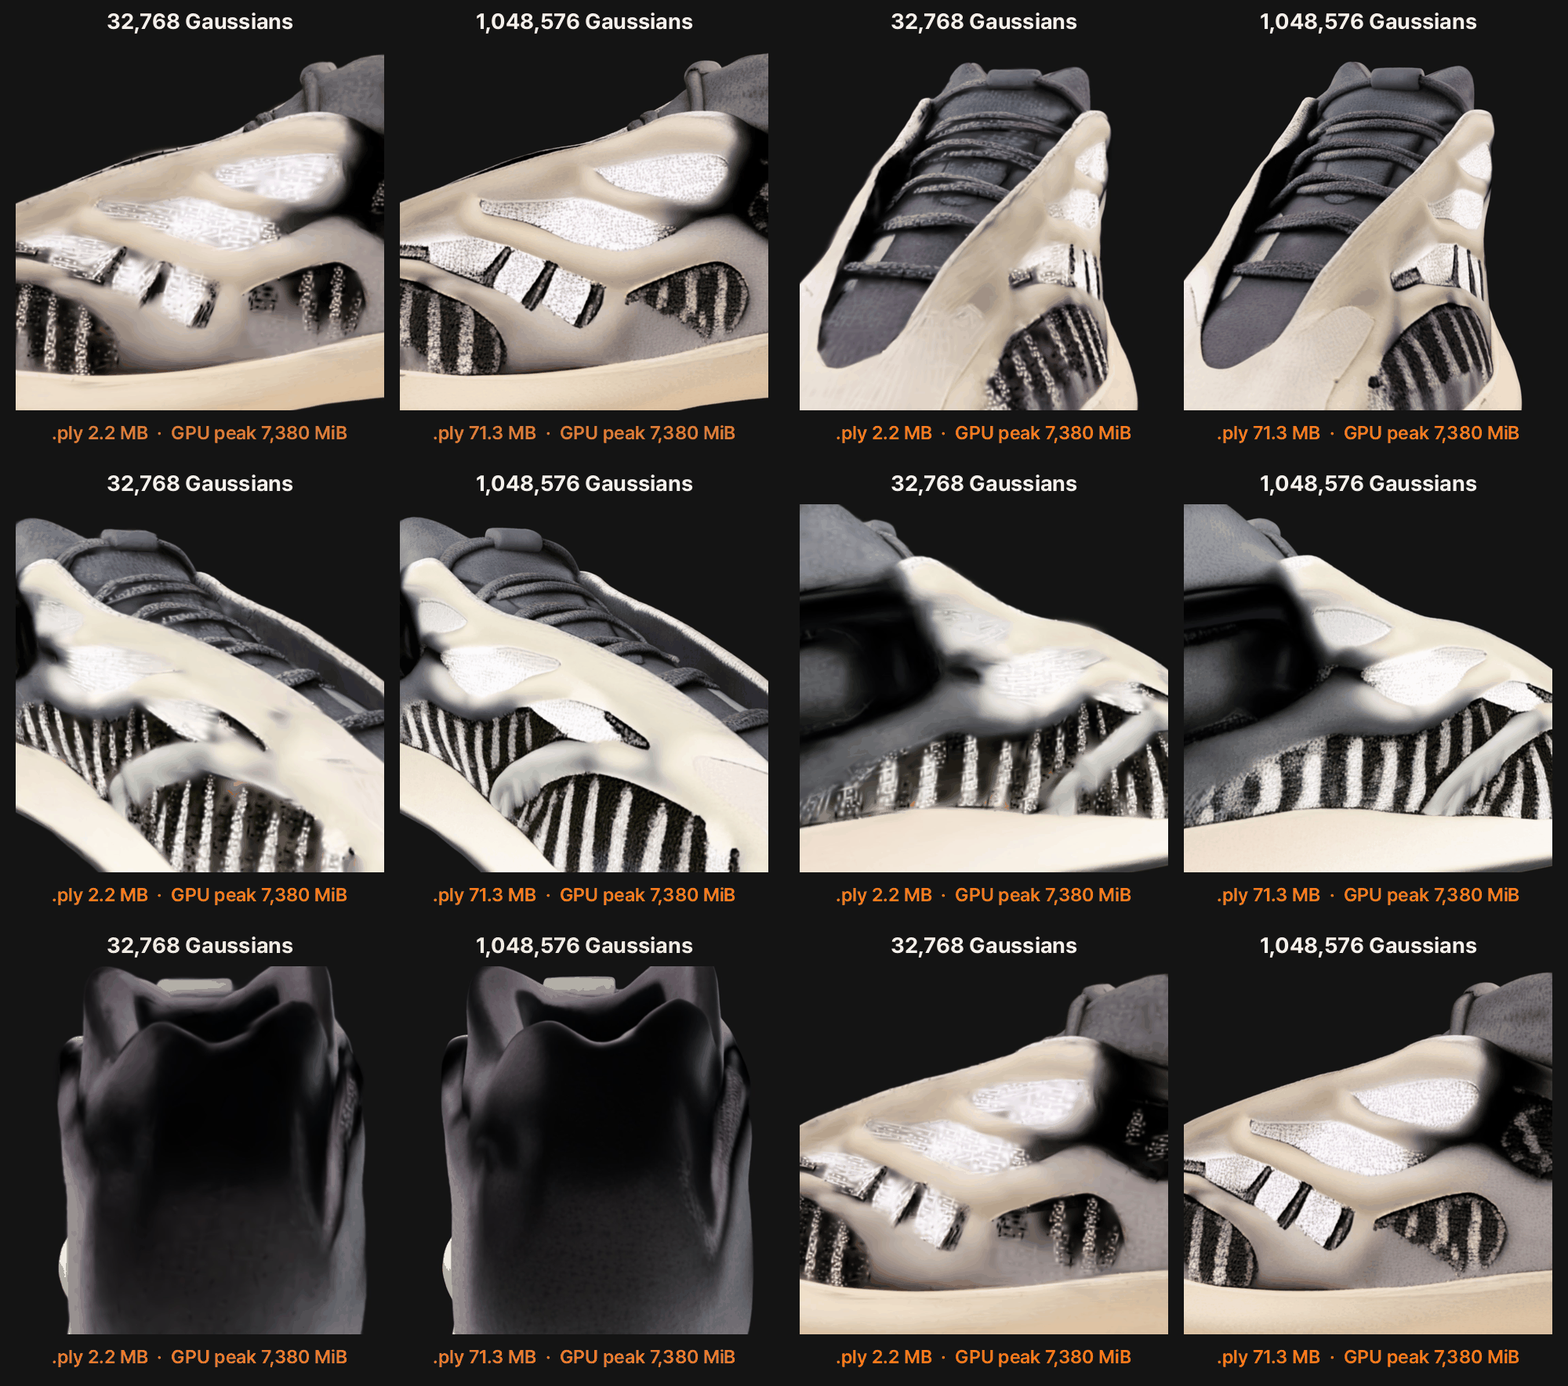
Going from 32,768 to 1,048,576 Gaussians, 32 times more, the shoe's nvidia-smi peak stayed at 7,380 MiB. The .ply went from 2.2 to 71.3 MB. On the README's preview images, peak allocated rose 54 MiB, which fits inside what PyTorch had already reserved. The model works on a fixed-size latent and places the Gaussians only in the last step, per the code. So for GPU memory during generation, the largest setting adds almost nothing to the peak. We did not measure what viewing a million-Gaussian file takes. The close-up looks sharper at a million, but we did not score quality.
It costs some time: on the preview images, warm time went from 17.2 to 18.0 seconds.
Speed on the A100
These are A100 seconds. They say nothing direct about an 8 GB card.
- 17.4 seconds per object at the default setting with the model loaded and warmed up (median of four requests across three objects; shoe 17.4, lantern 17.5, dragon 17.3, one or two requests each). The README lists 16.3 for an A100.
- 22.7 seconds for the first request in a later process. 34.9 seconds for the very first request, on a preview image. We attribute the difference to
torch.compile's cache on disk but did not isolate it. --no_optimizemade warm requests about 1.35 times slower on the preview images (23.4 vs 17.3 seconds) with the same peaks, so turning it off saves no memory.
The README's slowest consumer card is the 10 GB RTX 3080, at 46.2 seconds. It lists no 8 GB card.
Our predictions
We committed these before the first run, which used the README's preview images.
| Prediction | Result | |
|---|---|---|
| P1 | Peak allocated 5.0-7.2 GiB, and 7.2 GB within 0.3 GB of allocated or reserved | Wrong. 4.997 GiB; neither counter was close on the previews |
| P2 | nvidia-smi above reserved by 0.4-1.2 GiB | Right, 0.51 GiB |
| P3 | A million Gaussians adds at most 1.0 GiB allocated over 32,768 | Right, 54 MiB |
| P4 | --no_optimize: at most 0.5 GiB lower, 1.3-2.2 times slower | Right, same peaks, 1.35 times |
| P5 | .ply 71.3 and 2.2 MB, within 0.1 | Right |
| P6 | Under the 7,700 limit, all three Gaussian counts finish and fp32 runs out of memory | Half wrong. fp32 finished too |
| P7 | Under the 7,188 limit, at least one setting runs out of memory | Wrong. None did |
| P8 | Warm 13-20 s, first request at least 30 s longer | Half wrong. 17.2 s, but only 17.7 s longer |
With real photos, P1's reserved clause does hold, at 7.19 GB. We only saw that after the fact.
After we noticed the skipped step, we wrote two more sets of predictions, and both are post hoc. We wrote the first after already seeing the photo peak with no limit. So its predictions that bf16 would finish under both limits and stay below 7,680 were right but nearly settled in advance. Only the fp32 one was a real test: we said it would run out of memory under the 7,188 limit, and it finished. The second set was a real test: photos cut out beforehand would return to within 30 MiB of the preview images. They did (6,616 against 6,618 in nvidia-smi, 6,096 against 6,096 reserved).
Limits
- No real 8 GB card. We limited PyTorch to an 8 GB card's worth of memory on one A100. A real 8 GB card can differ in CUDA context and kernels, and may report slightly less than 8,192 MiB.
- 300 MiB is thin. The 512 MiB desktop is our assumption. A browser with hardware acceleration or a second monitor could take more, so close what you can, or use a card with no monitor attached.
- Few inputs. A shoe, a lantern and a generated dragon, plus four README preview images, each a 640x320 frame with the input beside Idol's own output. Within each group the peaks matched, but other inputs may differ.
- No quality measurement. We show what came out and didn't score it, at any setting.
- Some timings dropped. During the later photo runs, another job shared the GPU. Memory counters are per process and weren't affected, so we only report times from the runs that had the GPU alone.
Next step
If you are putting a GGUF text model on the same card with llama-server, you can estimate its memory from two short runs. For four LFM3 models (text, vision, audio, omni) on 4, 6 and 8 GB, see the LFM3 post.