Pick llama-server's -c From Two Short Runs, Not a VRAM Estimate: Load Memory Within 1 MiB at Seven Checked Lengths, and the Estimate Overshot Gemma 3 at 128K by 13.7 GiB
We started llama-server at 4K and 8K on Qwen3-8B, Qwen3.5-9B and Gemma 3 4B, drew a line through the two memory readings, and picked the longest -c under a memory budget. At the seven lengths we then started, the line predicted load memory within 1 MiB. Prompt processing added 12 to 14 MiB and pushed two picks over budget, so we subtract 16 MiB more. A simple all-layers estimate overshot Gemma 3 at 128K by 13.7 GiB.
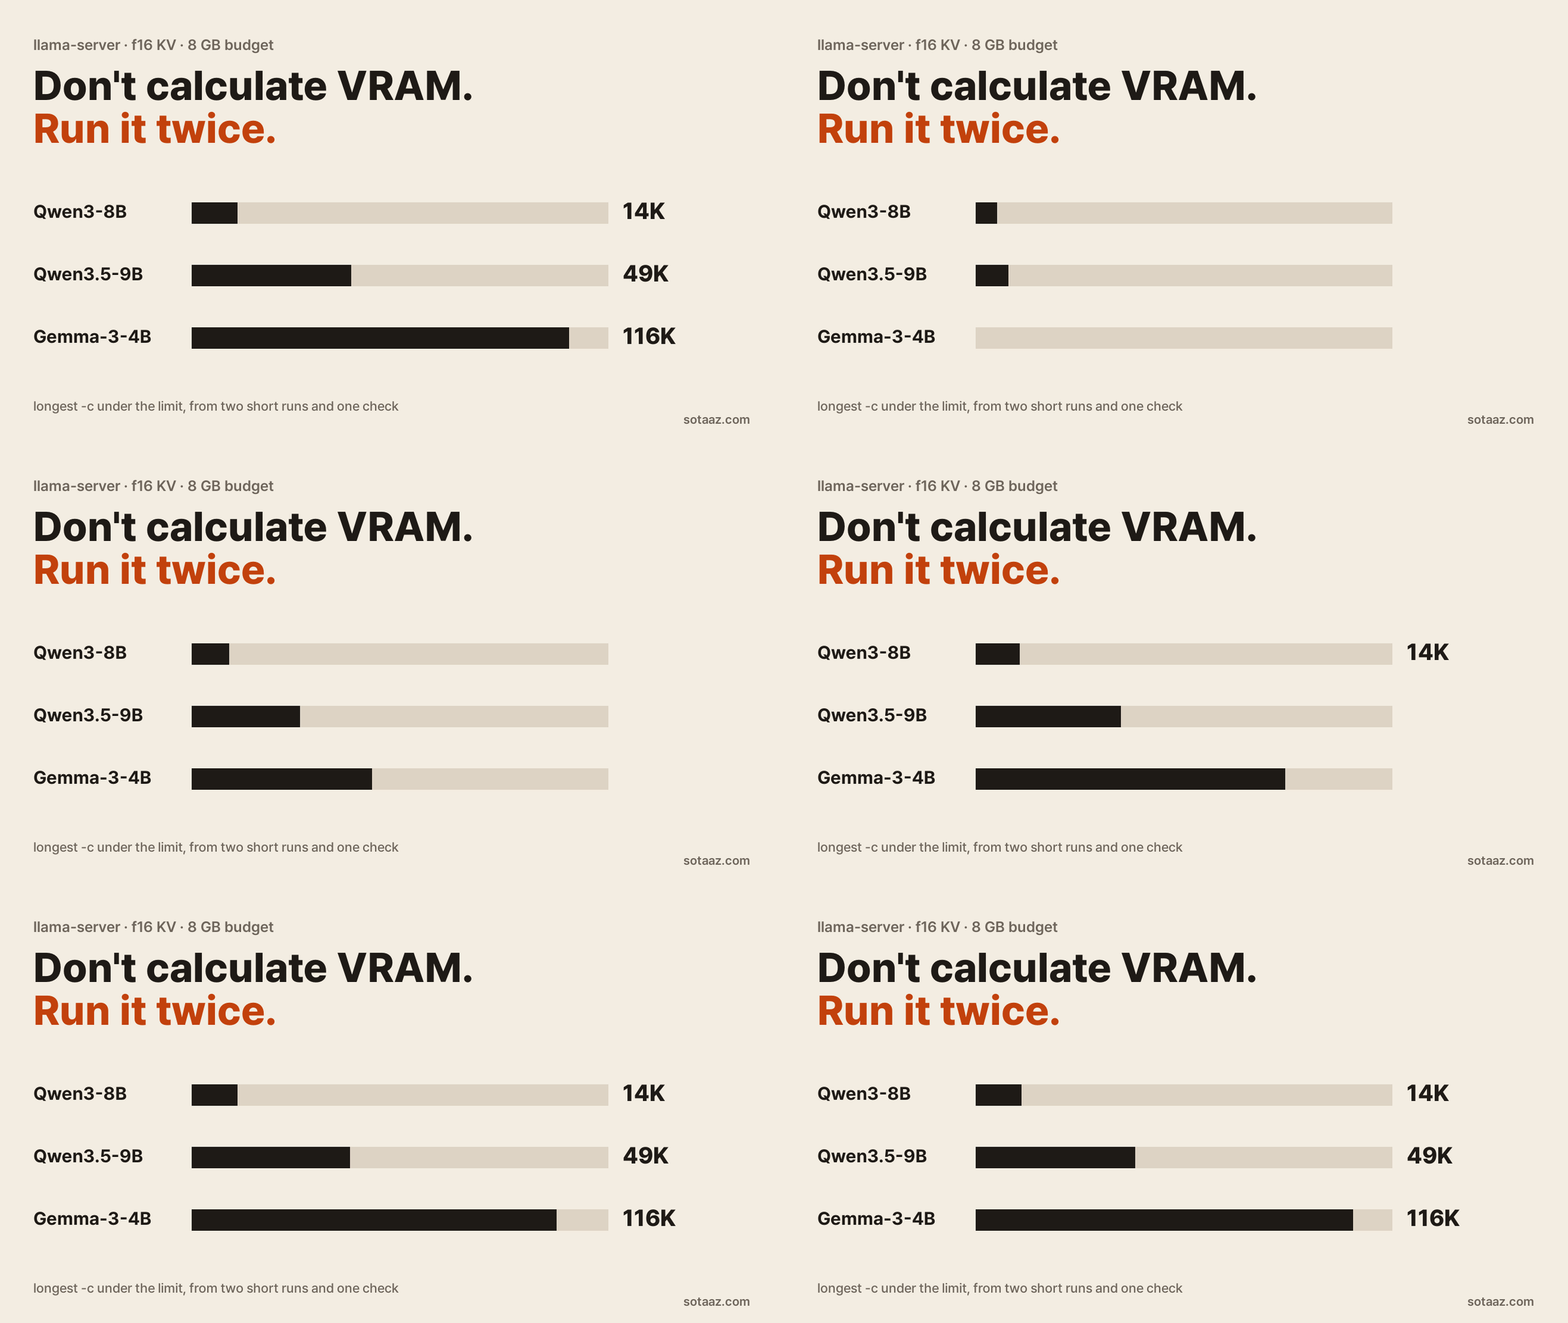
Pick llama-server's -c From Two Short Runs, Not a VRAM Estimate
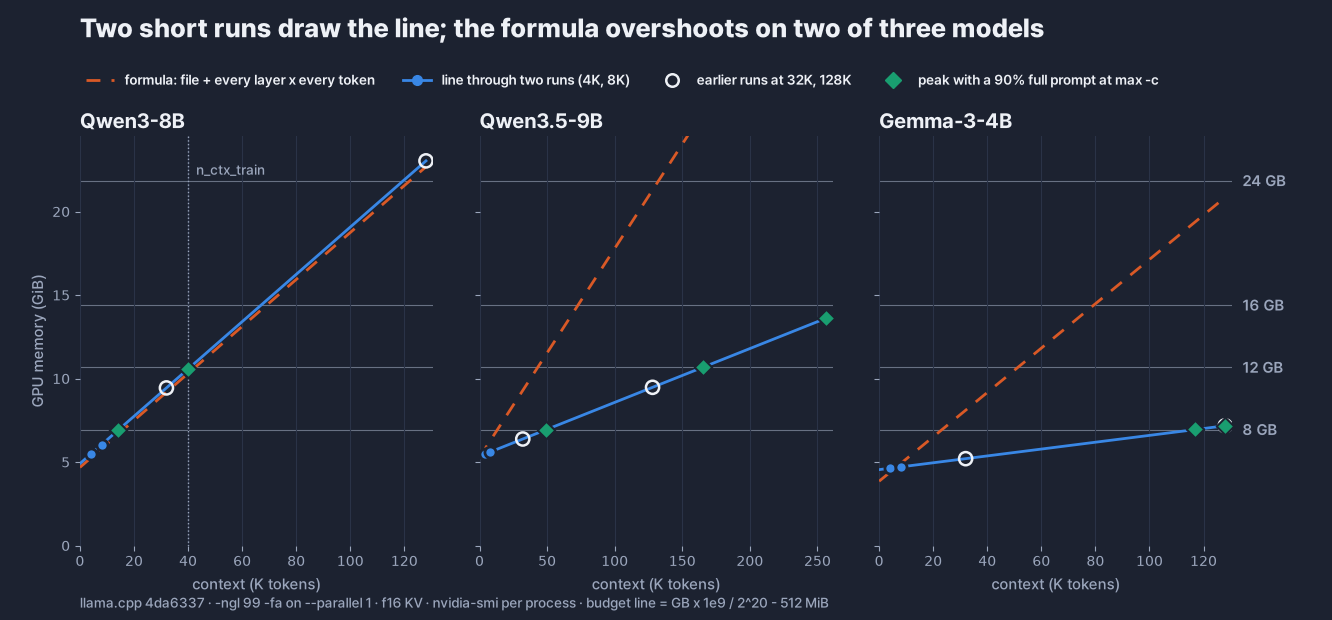
A common VRAM estimate, the one that assumes every layer is full attention, says Gemma 3 4B with a 128K context needs 20.9 GiB, which puts it on a 24 GB card. llama-server, started with that context, held 7.2 GiB. At 4K the same estimate was within 251 MiB of the measurement. Checked at a short length, the estimate looks right; the gap opens as the context grows.
So we stopped calculating and measured instead. Start llama-server once at 4K and once at 8K, and draw a straight line through the two memory readings. Read off the longest -c that fits your memory budget (we call it the max -c), and start once more at that length to check. At the seven lengths we started for the check, the line predicted load-time memory within 1 MiB. It also reproduced our earlier 32K and 128K readings to the MiB, though those were values we had already seen, not a blind test.
It missed once. Processing a prompt added 12 to 14 MiB, and that pushed two of the four lengths we first picked over budget, by 4 and 11 MiB. We now subtract 16 MiB more. This post is the corrected method, the numbers behind it, and where the estimate goes wrong.
This is part 1 of a series on fitting a local model to your GPU.
The setup
- Runtime: llama.cpp
4da6337,llama-server -ngl 99 -fa on --parallel 1 -c <length> -lv 4. Default f16 KV cache, one slot. - Models: Qwen3-8B Q4_K_M (every one of 36 layers uses full attention), Qwen3.5-9B Q4_K_M (8 of 32 layers use full attention, the rest keep a fixed-size state), Gemma 3 4B it Q8_0 (34 layers, most of them sliding-window).
- Reading: the process's memory in
nvidia-smi, three seconds after the server reported ready, plus thecommon_memory_breakdown_printline in the log. Every condition ran twice, and the two readings were identical every time. - GPU: one A100 80GB. We did not run on 8, 12, 16 or 24 GB cards; instead we set memory budgets and compared the A100 readings to them. Step 3 below says how the budgets were set.
We committed our predictions before each measurement round: five about the estimate, four about the method. All nine are scored at the end.
The method: two runs, one line, one check
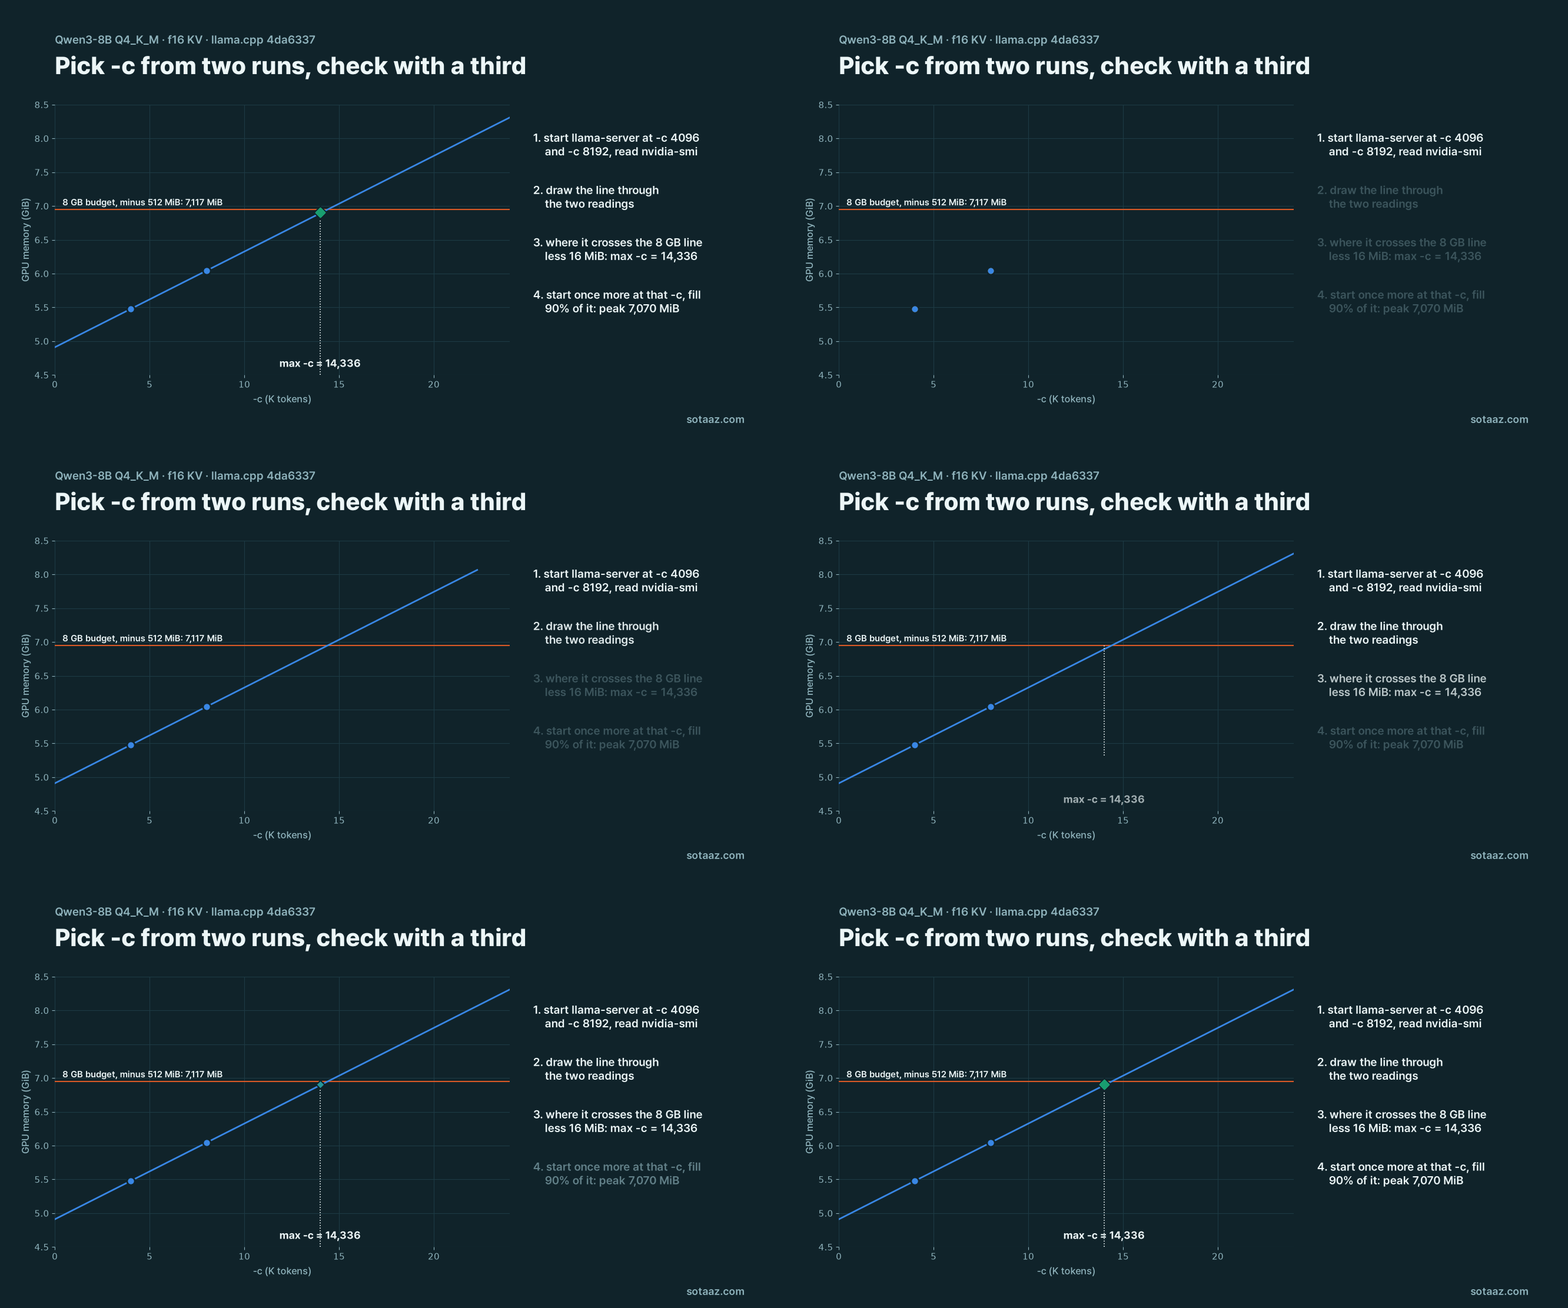
GPU memory is made of two kinds of pieces. Some are fixed whatever the context (model, about 480 MiB that no log line lists, Qwen3.5-9B's state, Gemma's window cache). The rest grow at a fixed rate per token (the full-attention KV cache). The compute buffer grows too, but in our runs it grew by 1 MiB per 1K tokens on every model (100, 128 and 224 MiB at 4K, 32K and 128K for Qwen3-8B), which is also a straight line. So two readings at two lengths are enough to draw the whole line. You do not need to know how many layers keep every token; the slope already contains it.
- Start the server at
-c 4096, wait for it to report ready, and read the process's memory:nvidia-smi --query-compute-apps=pid,used_memory --format=csv. Call it M1. Stop the server. - Do the same at
-c 8192. Call it M2. The slope is (M2 − M1) ÷ 4,096, in MiB per token. - Set your memory budget L. Before starting the server, read the free memory with
nvidia-smi --query-gpu=memory.free --format=csvand subtract 512 MiB, a reserve for the driver and anything else that starts later. We had no small cards, so we took the card size in decimal GB, converted it to MiB and subtracted 512: for 8 GB, 8 × 10⁹ ÷ 2²⁰ − 512 = 7,117 MiB. Real cards are sized in binary units, and an 8 GB card reports a total close to 8 GiB (8,192 MiB), so our budget is about 560 MiB more conservative than a real 8 GB card, and about 1.6 GiB more than a 24 GB one. "8 GB" in the tables below is the name of this budget. - Compute max -c = 4,096 + (L − 16 − M1) ÷ slope, round it down to a multiple of 1,024, and cap it at the limit in the GGUF metadata (
n_ctx_train). The 16 MiB covers the 12 to 14 MiB we saw during prompt processing in this experiment; more on that below. - Start once more at that length and send a prompt as long as you will really use, watching the peak. If you will use long outputs, generate that much in the check run and measure it. We filled 90% of the context and generated only one token.
We picked 8K as the second point because 32K would not fit Qwen3-8B on an 8 GB card at all (9,668 MiB), and the method should work on the card you are sizing for.
Did the line hold?
| Model | 4K | 8K | Slope (MiB per 1K tokens) | Line at 32K | Run at 32K | Line at 128K | Run at 128K |
|---|---|---|---|---|---|---|---|
| Qwen3-8B | 5,608 | 6,188 | 145 | 9,668 | 9,668 | 23,588 | 23,588 |
| Qwen3.5-9B | 5,612 | 5,744 | 33 | 6,536 | 6,536 | 9,704 | 9,704 |
| Gemma 3 4B | 4,742 | 4,826 | 21 | 5,330 | 5,330 | 7,346 | 7,346 |
The line through two points reproduced all six 32K and 128K readings exactly. We had predicted within 16 MiB. Those readings, though, came from the first round, so we had already seen them. A line through the first-round 4K and 32K readings had already hit 128K exactly, and that is where this method came from. The 32K and 128K readings were not used to draw the 4K/8K line, but this is not a prediction made blind. The blind test is the check runs in the next section.
Checking at the max -c
We computed the max -c for the 8, 12, 16 and 24 GB budgets from the line, before adding the 16 MiB, committed the predictions, and then started the server. Each distinct length ran twice with a prompt filling 90% of it; the peak is the largest nvidia-smi reading taken every 0.2 seconds.
| Model | Budget | Max -c | Line | Load | Peak, polled every 0.2 s | Budget − peak |
|---|---|---|---|---|---|---|
| Qwen3-8B | 8 GB | 14,336 | 7,058 | 7,058 | 7,070 | 47 |
| Qwen3-8B | 12 GB and up | 40,960 (cap) | 10,828 | 10,828 | 10,840 | 92 |
| Qwen3.5-9B | 8 GB | 50,176 | 7,097 | 7,096 | 7,110 | 7 |
| Qwen3.5-9B | 12 GB | 168,960 | 10,925 | 10,924 | 10,936 | −4 |
| Qwen3.5-9B | 16 GB and up | 262,144 (cap) | 13,928 | 13,928 | 13,942 | 805 |
| Gemma 3 4B | 8 GB | 119,808 | 7,115 | 7,116 | 7,128 | −11 |
| Gemma 3 4B | 12 GB and up | 131,072 (cap) | 7,346 | 7,346 | 7,358 | 3,574 |
The line predicted load-time memory within 1 MiB at all seven lengths. Processing the prompt added 12 to 14 MiB in all fourteen runs, and that was enough to push two cells over budget, by 4 and 11 MiB. Rounding the max -c down to a multiple of 1,024 had left those two with less room than the prompt needed.
We had predicted that every length picked this way would stay under budget, and it did not. The overshoot is inside the 512 MiB reserve, our budgets are more conservative than real cards as noted above, and we did not run on real cards, so this is not an observed out-of-memory error. But a method that picks the length should not depend on the reserve.
So we added the 16 MiB to step 4 and committed a prediction before running again: subtracting 16 MiB moves only those two cells down one step, and both should stay under budget. Both did:
| Model | Budget | New max -c | Load | Peak, polled every 0.2 s | Budget − peak |
|---|---|---|---|---|---|
| Gemma 3 4B | 8 GB | 118,784 | 7,094 | 7,106 | 11 |
| Qwen3.5-9B | 12 GB | 167,936 | 10,892 | 10,906 | 26 |
This correction came after the miss, so it is a fix we tested once, not a prediction that held from the start, and the 16 MiB is what we saw under these conditions (A100, one prompt, one generated token).
The max -c for each budget
From the line, with the 16 MiB correction. Treat these as candidates rather than settings to copy: recompute with your card's free memory as in step 3, then check with step 5.
| Model | 8 GB | 12 GB | 16 GB | 24 GB | Estimate's pick at 8 GB | At 8 GiB (calculated only) |
|---|---|---|---|---|---|---|
| Qwen3-8B Q4_K_M | 14,336 | 40,960 (cap) | 40,960 | 40,960 | 16,384 | 18,432 |
| Qwen3.5-9B Q4_K_M | 50,176 | 167,936 | 262,144 (cap) | 262,144 | 13,312 | 67,584 |
| Gemma 3 4B Q8_0 | 118,784 | 131,072 (cap) | 131,072 | 131,072 | 23,552 | 131,072 (cap) |
The last column uses a budget of 8,192 − 512 = 7,680 MiB on the same lines; we did not start the server at those lengths. At 12 GiB only Qwen3.5-9B changes, to 194,560, and everything at 16 GB and up is already at the cap.
The estimate column is calculated, not run: it is where the estimate's own line crosses the 8 GB budget. On our 8 GB budget the estimate picks contexts 3.8 and 5.0 times shorter than the line for Qwen3.5-9B and Gemma 3 4B. For Qwen3-8B it goes the other way and picks 16,384, where the line puts load-time memory at 7,348 MiB, 231 over our budget. That is inside the 512 MiB reserve and would fit an 8 GiB budget (7,680 MiB), so the large error is the too-short picks on the other two models.
Where the estimate goes wrong
The estimate we compared against is the simple arithmetic that assumes every layer stores K and V for every token:
total = GGUF file size + layers × KV heads × (K head size + V head size) × 2 bytes × context length
We did not test any particular online calculator; we put this arithmetic next to the measurements:
| Model | Context | Estimate | Measured | Estimate − measured |
|---|---|---|---|---|
| Qwen3-8B | 4K | 5,371 MiB | 5,608 | −237 |
| Qwen3-8B | 32K | 9,403 | 9,668 | −265 |
| Qwen3-8B | 128K | 23,227 | 23,588 | −361 |
| Qwen3.5-9B | 4K | 5,929 | 5,612 | +317 |
| Qwen3.5-9B | 32K | 9,513 | 6,536 | +2,977 |
| Qwen3.5-9B | 128K | 21,801 | 9,704 | +12,097 |
| Gemma 3 4B | 4K | 4,491 | 4,742 | −251 |
| Gemma 3 4B | 32K | 8,299 | 5,330 | +2,969 |
| Gemma 3 4B | 128K | 21,355 | 7,346 | +14,009 |
For Qwen3-8B the estimate is a few hundred MiB low. For the other two it is close at 4K and then overshoots more and more, until at 128K it asks for 2.2 times (Qwen3.5-9B) and 2.9 times (Gemma 3 4B) what the server used.
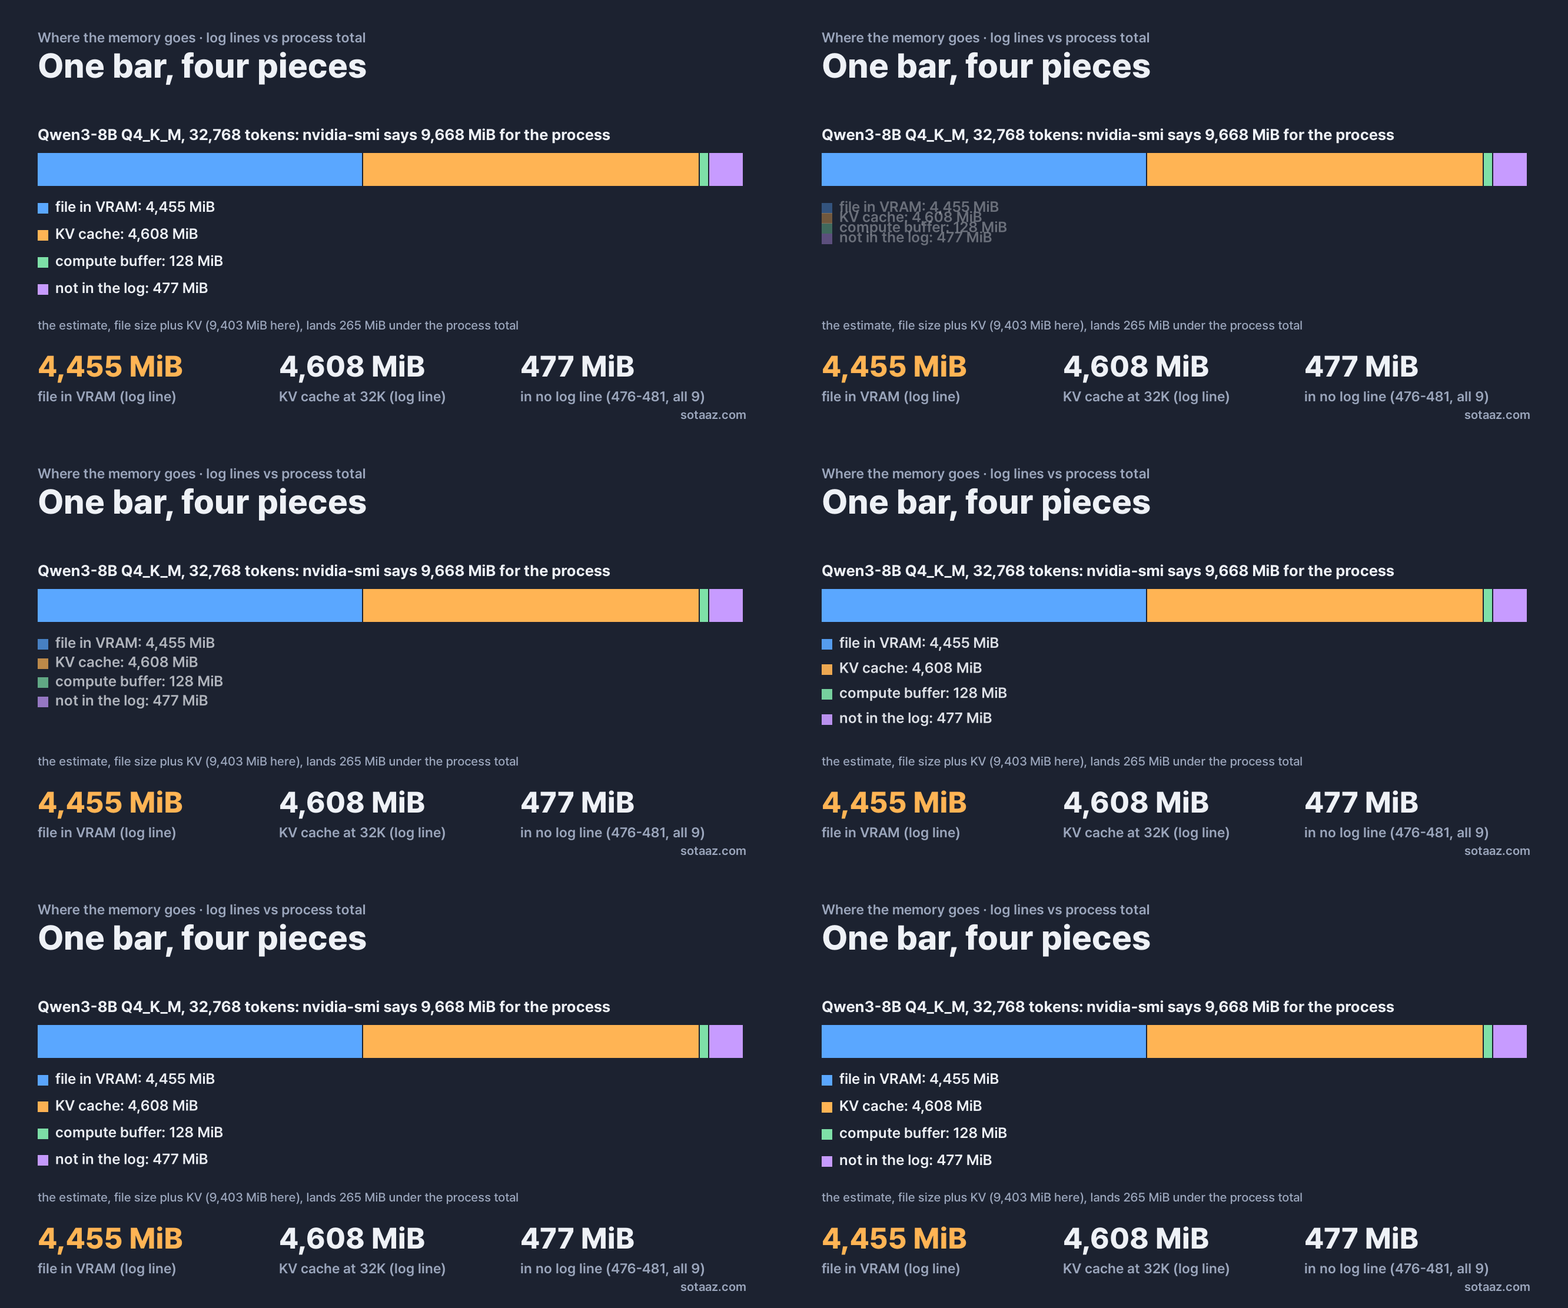
The log splits the Qwen3-8B 32K total into three pieces, and nvidia-smi adds a fourth:
| - CUDA0 (A100 80GB PCIe) | 81151 = 77113 + (9191 = 4455 + 4608 + 128) + -5152 |- Model, 4,455 MiB, 340 MiB less than the 4,795 MiB file; 334 MiB of that sits in a
CPU_Mapped model buffer. Qwen3.5-9B splits the same way. Gemma 3 4B does not: its GPU part is only 14 MiB under the file, and 680 MiB on the CPU comes on top. We did not check which tensors stay on the CPU. - KV cache, 4,608 MiB, exactly the estimate's 144 KiB per token for this model.
- Compute buffer, 128 MiB. Across all nine conditions it was 79 to 224 MiB, the smallest of the four pieces.
- About 480 MiB in no log line. Process total minus the three logged pieces was 476 to 481 MiB in all nine conditions, constant for each model at every length. It looks like the CUDA context and libraries every CUDA process carries, but we did not measure that directly.
That explains the few hundred MiB on Qwen3-8B. The gap on the other two (12,097 and 14,009 MiB at 128K) comes from the assumption that every layer keeps every token:
- Qwen3.5-9B uses full attention in only 8 of 32 layers. At 128K the log reads
4096.00 MiB (131072 cells, 8 layers), plus a 50.25 MiBRS bufferthat does not grow with context. The estimate counted 32 layers, 16,384 MiB. - Gemma 3 4B keeps a full cache in 5 layers (2,560 MiB at 128K) and a 1,536-cell sliding-window cache in the other 29 (174 MiB at any length). We worked out why it is 1,536 cells (the 1,024-token window plus one 512-token micro-batch) in the llama.cpp vs vLLM memory post. The estimate counted 34 full layers, 17,408 MiB.
The slopes say it in one number each. The estimate's slope is 144 MiB per 1K tokens for Qwen3-8B, 128 for Qwen3.5-9B and 136 for Gemma 3 4B. The measured slopes are 145, 33 and 21; on all three models 1 MiB of that is the compute buffer and the rest (144, 32 and 20) is the KV cache. We measured these cache layouts for six models in the KV cache by model post.
Our predictions, scored
Before the first round (the estimate):
| Prediction | Result | |
|---|---|---|
| P1 | Qwen3-8B: estimate within 1,024 MiB at all three lengths, and below the measurement | Hit: −237, −265, −361 |
| P2 | Qwen3.5-9B at 128K: estimate at least 10,000 MiB too high (only 8 layers hold KV) | Hit: +12,097 |
| P3 | Gemma 3 4B at 128K: estimate at least 12,000 MiB too high (the sliding-window cache does not grow with context) | Hit: +14,009 |
| P4 | Process memory 150 to 700 MiB above the logged pieces, in all nine conditions | Hit: 476 to 481 |
| P5 | Gemma's compute buffer larger than Qwen3-8B's at the same length | Missed: 79 against 100, 107 against 128, 203 against 224 MiB |
Before the second round (the method):
| Prediction | Result | |
|---|---|---|
| F1 | The 4K/8K line matches the 32K and 128K readings within 16 MiB | Hit: 0 MiB, all six |
| F2 | Max -c from 4K/8K matches the value we had computed from the first round, within 1,024 | Hit: identical |
| F3 | Peak during a 90% prompt is 0 to 64 MiB above load | Hit: 12 to 14 MiB, all fourteen runs |
| F4 | At the four lengths not at the cap, peak stays under budget, and the room left is less than one step (slope × 1,024) plus 64 MiB | Missed: 2 of 4 over, by 4 and 11 MiB |
P5 came from Gemma 3's 262K-word vocabulary: we assumed a bigger output layer needs a bigger compute buffer. It did not, and the logs did not tell us why. F4 is the miss that changed the method.
Limits
- One A100 80GB, Linux, one build. The 476 to 481 MiB and the 12 to 14 MiB may differ on another GPU or driver, and we did not run on a small card. Our budgets were set from decimal GB, not from a real card's
memory.free. If yournvidia-smidoes not show per-process memory, the log's breakdown line plus the unlisted part is a fallback, but we only know that part's size on this machine. - f16 KV cache only. With an 8-bit cache the compute buffer grows much faster with context, as we found in the 8 GB context budget post, and we have not checked whether two points still give a straight line.
- Prompt processing, not long generation. Each check sent one prompt and generated one token, and memory was polled every 0.2 seconds; a peak shorter than that could have been missed.
- Three models. Other layouts (MLA, other window sizes) should still be lines if every piece is fixed or per-token, but we have not run them.
- The cap is a GGUF metadata value. "Cap" in the tables is the
n_ctx_trainwritten in each GGUF. For Qwen3-8B that is 40,960, while the model card describes a native context of 32,768 and 131,072 with YaRN. Read the Qwen3-8B 128K run as a memory number only.
Next
The line's starting point is mostly the model file. The next part changes that: Q8_0, Q4_K_M and Q3_K_L of the same model, how many tokens of context each gigabyte saved buys on these cards, and what it costs in accuracy. The newsletter below sends each part when it is out.