Pick a GGUF That Fits Your GPU in llama.cpp, and Catch the Silent Slowdown
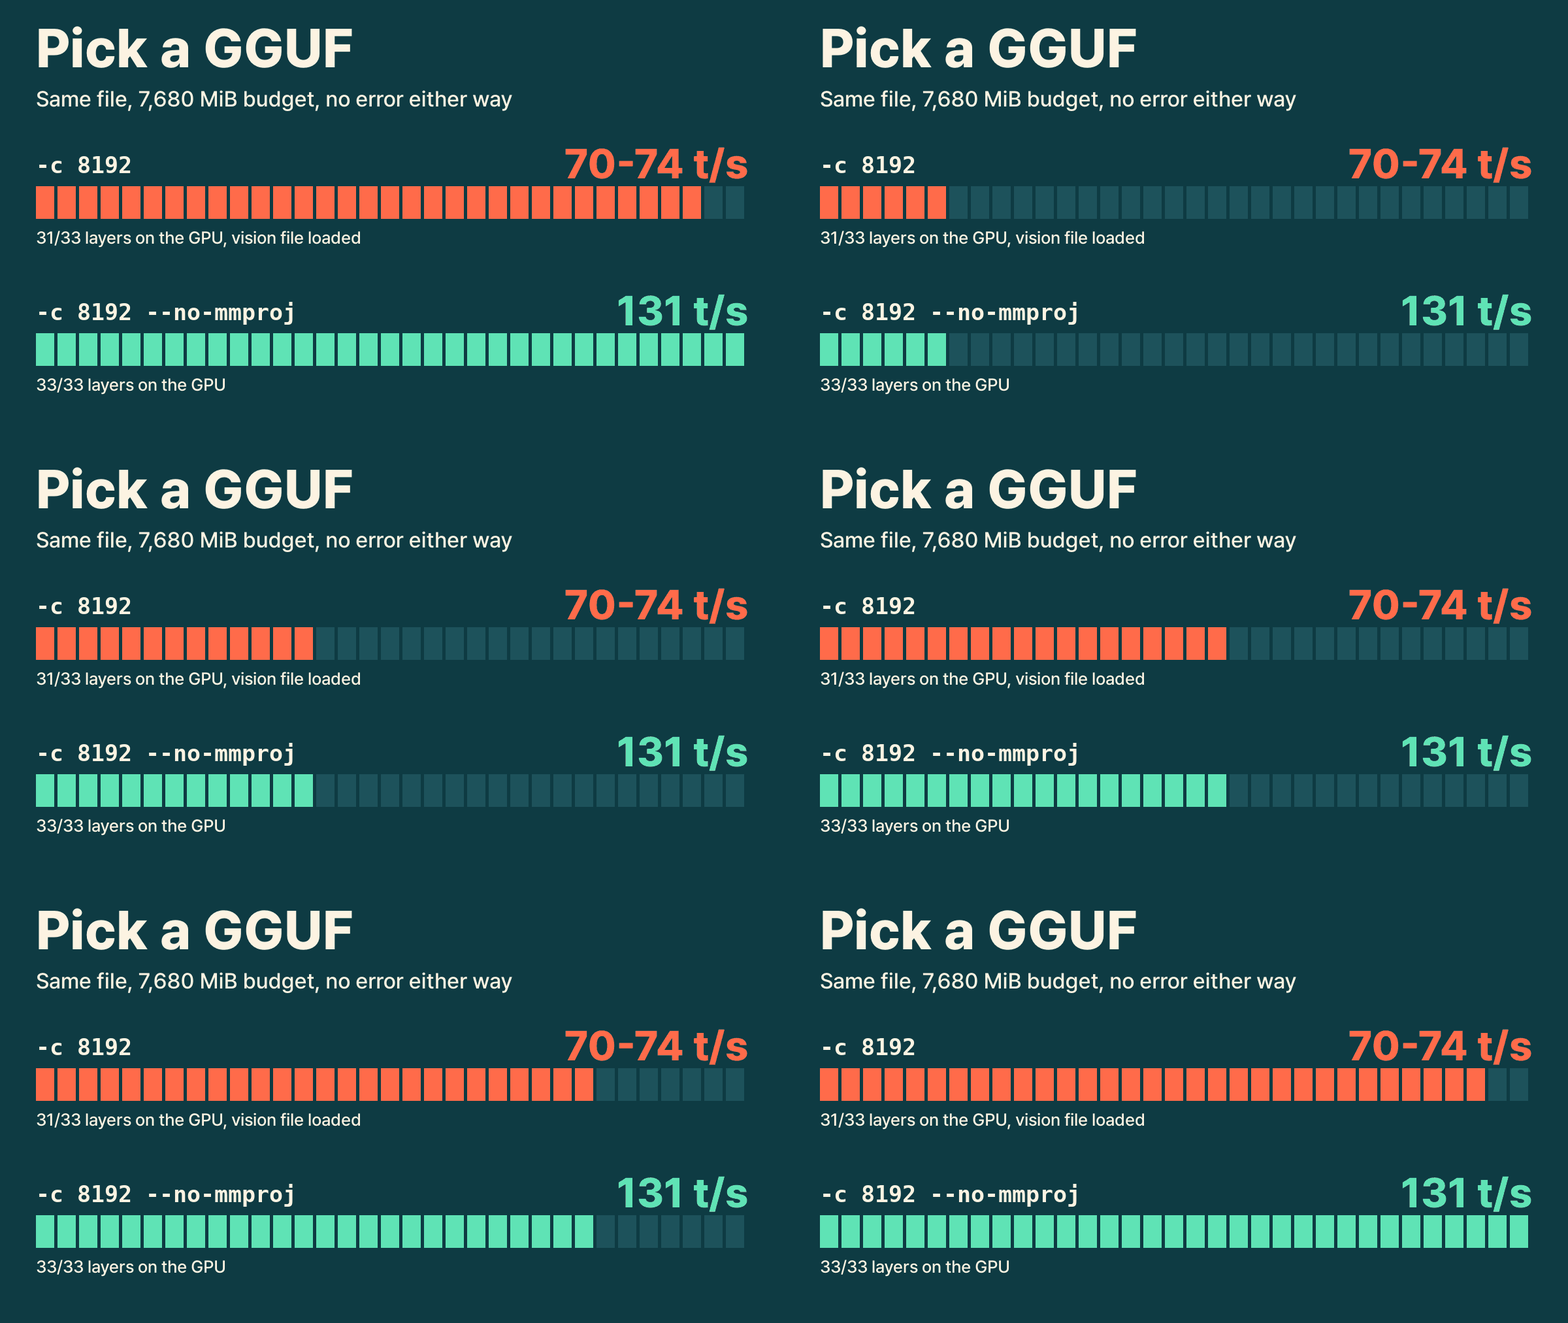
Choose a llama.cpp model file for your VRAM and check that it fits. On a 7,680 MiB budget on an A100, at -c 8192, Qwen3.5-9B ran at about 72 t/s with its vision file and 131 t/s with --no-mmproj, no error either way.
Pick a GGUF That Fits Your GPU in llama.cpp, and Catch the Silent Slowdown
One flag took the same model file from about 72 tokens per second to 131. We ran llama.cpp on an 8 GB memory budget, emulated on an A100, and asked for an 8K context. It answered with no error and no warning on screen. It had also moved 2 of the model's 33 layers to the CPU, because it had loaded a vision file we never asked for. --no-mmproj brought them back.
This is episode 2 of our series on running llama.cpp on your own server. By the end you will have one model file chosen for your card, and a way to tell whether it really fits. In this post, a file fits when every layer stays on the GPU. Episode 1 got you a working llama program.
What we ran, and what we did not
The model is Qwen3.5-9B from unsloth/Qwen3.5-9B-GGUF, on llama.cpp build 12079 (commit 71efc559a). The prompt was "Explain in three paragraphs what a GPU does." with -n 128 --reasoning off. Episode 1 tested build 12033. To match this post, run git fetch origin and git checkout 71efc559a, then repeat the two build commands from episode 1's Step 3 with -DGGML_CUDA_NCCL=OFF added to the cmake -B build line. We reconfigured our existing build folder with cmake -B build -DGGML_CUDA_NCCL=OFF, which keeps the earlier options. The last table below explains that option. We did not check whether build 12033 behaves the same.
We do not have an 8 GB card. We ran everything on an A100 80GB and told --fit, the option that sizes a model to your card, to behave as if only part of its memory were free. Nothing enforces that limit, so this tests the choices llama.cpp makes on a budget, and it never tests what happens when real memory runs out.
"8 GB" can also mean several things, and the answer changes with it. Our main budget is 7,680 MiB: 8,192 minus 512 for a desktop. We also ran 8,192 MiB for a server with no display, and 7,117 MiB for a card where something else has taken another 563 MiB. On our card llama.cpp reads about 423 MiB less free memory than nvidia-smi, which we take to be what CUDA itself uses. Our budgets count that as used, and we assume a smaller card loses a similar amount. We did not check that.
Our runs add a large -fitt value to create the budget, such as -fitt 74493 for 7,680 MiB. Leave it out on a real card. The commands below show what you would type.
Speeds are A100 speeds, so use them to compare rows, and expect your own numbers to differ. Unless a row says otherwise, each speed comes from three runs without --verbose, with no other process on the GPU. Layer counts and contexts come from the same settings with --verbose, because the normal output does not print them.
Read the file name first
That repository has 22 model files and 3 vision files. The size of each is listed on Hugging Face, and five parts of the name tell you what you are looking at:
| In the name | What it tells you | Examples, file size |
|---|---|---|
Q3, Q4, Q5, Q6, Q8 | Roughly how many bits each weight keeps. The log reports 5.07 bits on average for Q4_K_M and 8.50 for Q8_0 | Q3_K_M 4.67 GB, Q8_0 9.53 GB |
_K_S, _K_M, _K_XL | Size variants of the same family | Q4_K_S 5.39 GB, Q4_K_M 5.68 GB, UD-Q4_K_XL 5.97 GB |
IQ | A different quantization family, which we did not run here | IQ4_XS 5.17 GB |
UD- | A label this publisher puts on some of its files, which we did not run here | UD-Q3_K_XL 5.05 GB |
mmproj- | The vision part, used next to a model file and not on its own | mmproj-F16 and mmproj-BF16 0.92 GB, mmproj-F32 1.82 GB |
If you give -hf a repository and no file, llama.cpp takes Q4_K_M and a vision file, here mmproj-BF16. To name a file, add it after a colon: -hf unsloth/Qwen3.5-9B-GGUF:Q5_K_M. Naming a file does not stop the vision file. --no-mmproj does.
Step 1: turn off what you do not use
Here is the first thing to fix. Every row below uses the same Q4_K_M file, the same 7,680 MiB budget and the same prompt. Only the flags change:
After -hf | Layers on GPU | Context | Peak GPU memory | Speed |
|---|---|---|---|---|
unsloth/Qwen3.5-9B-GGUF | 32/33 | 4,096 | 6,620 MiB | 101.2-106.9 t/s |
unsloth/Qwen3.5-9B-GGUF -c 8192 | 31/33 | 8,192 | 6,618 MiB | 69.8-74.2 t/s |
unsloth/Qwen3.5-9B-GGUF:Q4_K_M --no-mmproj | 33/33 | 37,632 | 6,712 MiB | 130.7-131.3 t/s |
unsloth/Qwen3.5-9B-GGUF:Q4_K_M --no-mmproj -c 8192 | 33/33 | 8,192 | 5,764 MiB | 130.9-131.8 t/s |
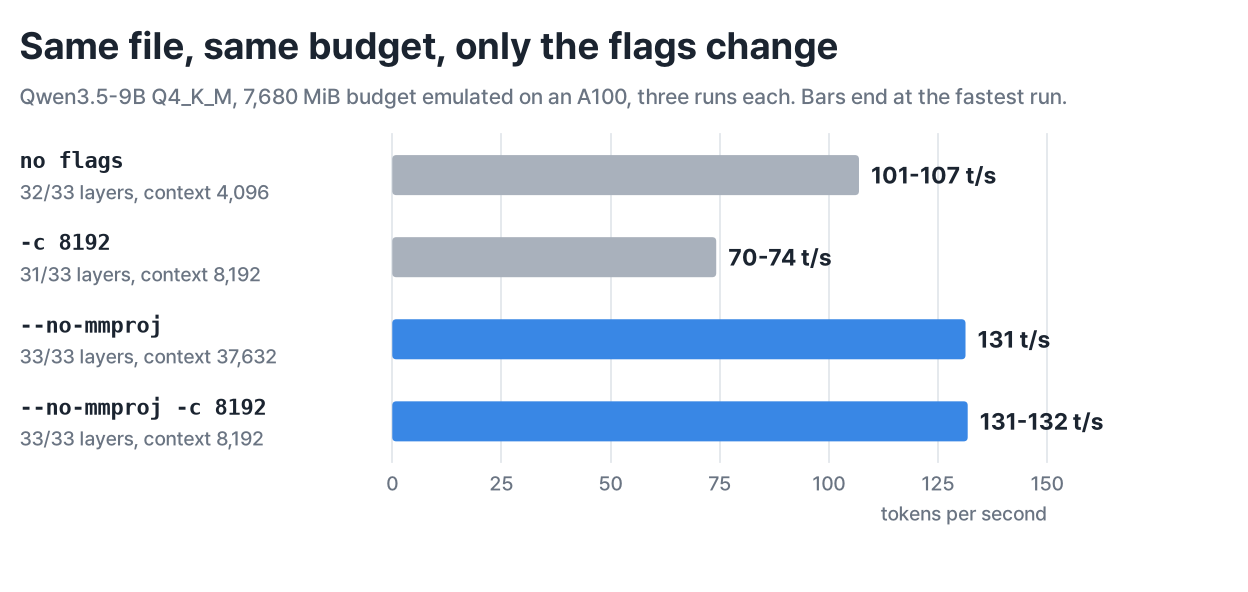
The vision file costs 1,130 MiB on the card: with no budget at -c 8192, peak memory was 6,894 MiB with it and 5,764 MiB without. Before loading, the log adds 1,127 MiB to what --fit must keep free. So --fit cut the context all the way to its 4,096 floor, and when that was not enough it moved a layer to the CPU. -c 8192 makes it worse, because that takes the context cut away and leaves only layers to move.
How much this costs depends on how much memory is really free. Here is the plainest command, -hf unsloth/Qwen3.5-9B-GGUF with no flags, on all three budgets:
| Budget | Layers on GPU | Context | Peak GPU memory | Speed |
|---|---|---|---|---|
| 8,192 MiB, no display | 33/33 | 18,688 | 7,232 MiB | 130.8-131.7 t/s |
| 7,680 MiB, with a desktop | 32/33 | 4,096 | 6,620 MiB | 101.2-106.9 t/s |
| 7,117 MiB, 563 MiB more taken | 28/33 | 4,096 | 6,090 MiB | 41.1-43.4 t/s |
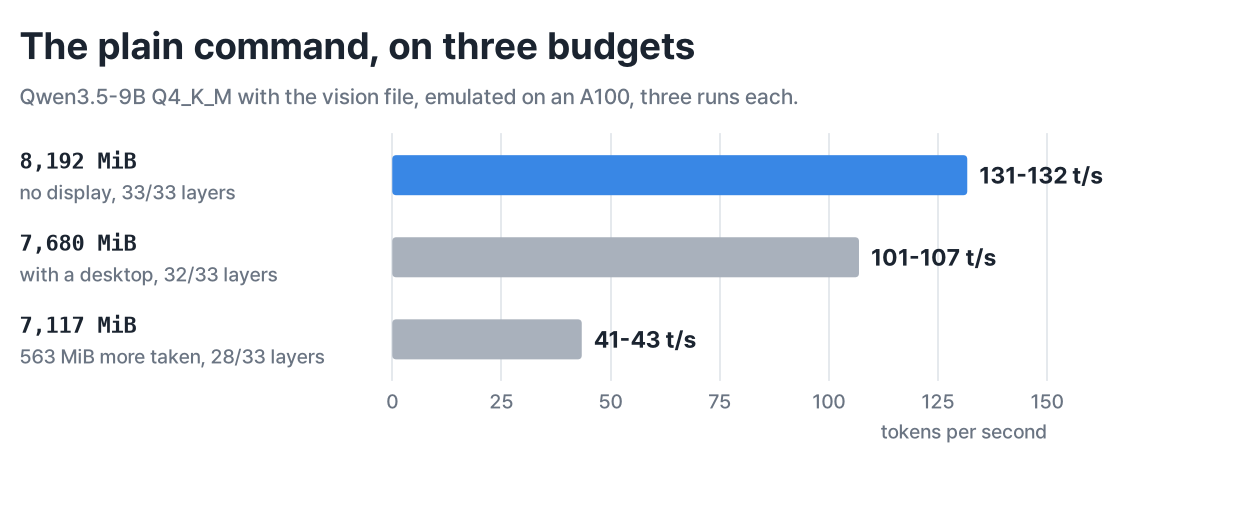
With nothing else on the card and no display, the plain command loses no speed in this test: a 128-token text prompt on our emulated 8,192 MiB. A real card may have less free, and the context of 18,688 may differ. Take away 1,075 MiB and it runs at about a third of that speed, and the screen looks the same. So if you only send text, turn the vision file off whatever your budget is:
./build/bin/llama cli -hf unsloth/Qwen3.5-9B-GGUF:Q4_K_M --no-mmproj \
  -st -n 128 --reasoning off \
  -p "Explain in three paragraphs what a GPU does."
Our first run, which downloaded the default file and the vision file at -c 4096 and wrote a 16-token answer, took 12 minutes 15 seconds in all. It depends on your connection. With --no-mmproj the vision file is not fetched. If you want to send images, keep the vision file and see Step 3.
Step 2: find the largest file that fits
Now keep the flags and change the file. Every row is --no-mmproj -c 8192 on the same 7,680 MiB budget:
| File | File size | Layers on GPU | Peak GPU memory | Speed on the budget | Speed with no budget |
|---|---|---|---|---|---|
Q3_K_M | 4.67 GB | 33/33 | 4,932 MiB | 134.8-135.7 t/s | 135.5-135.8 t/s |
Q4_K_M | 5.68 GB | 33/33 | 5,764 MiB | 130.9-131.8 t/s | 131.4-131.6 t/s |
Q5_K_M | 6.58 GB | 33/33 | 6,498 MiB | 122.8-123.7 t/s | 123.5-123.7 t/s |
Q6_K | 7.46 GB | 30/33 | 6,682 MiB | 46.8-49.5 t/s | 120.0-120.1 t/s |
Q8_0 | 9.53 GB | 23/33 | 6,712 MiB | 18.6-19.1 t/s | 117.3-117.5 t/s |
The last column comes from three runs with --fit off -ngl 99, which keeps every layer on the GPU.
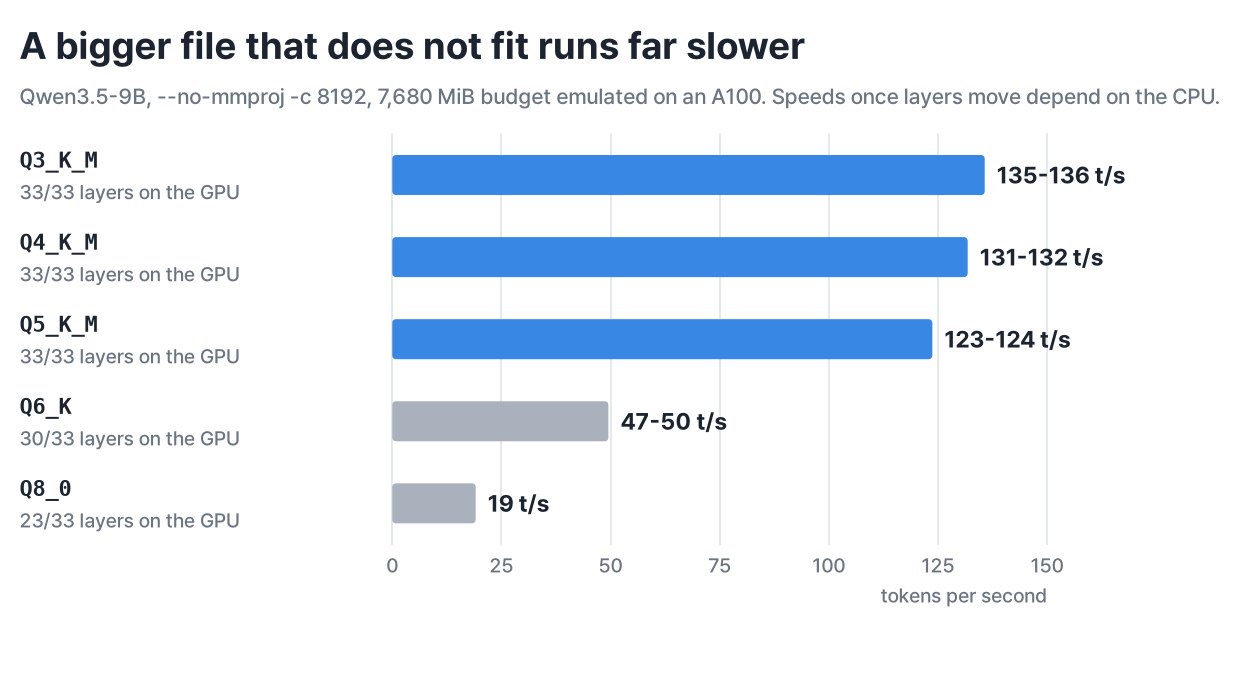
Three layers on the CPU took Q6_K from 120 t/s to about 48. Ten took Q8_0 from 117 t/s to about 19. Both loaded without complaint, and the speed line is the only sign on the screen. So the file that looks best on paper can be the slowest choice on a budget.
On this budget we would pick Q5_K_M, and speed is not the reason. Q3_K_M is faster, and all three fitting files run within about 10 % of each other. A larger file keeps more bits per weight. In an earlier measurement on encyclopedia text, this model's UD-Q3_K_XL agreed with its Q8_0 on the top next token 90.6 % of the time, and Q4_K_M 92.8 %. That was another build, it did not include Q3_K_M, Q5_K_M or Q6_K, and it measures agreement with the 8-bit file, not your task. So choosing the largest file that fits is our judgment, and this post did not measure it. If you want room for a browser, Q4_K_M leaves 734 MiB more.
The largest file changes with the budget. All rows here are --no-mmproj -c 8192 at the default margin:
| Budget | Largest of the five with every layer | Speed | The next size up |
|---|---|---|---|
| 7,117 MiB | Q4_K_M | 130.7-131.8 t/s | Q5_K_M 30/33, 53.4-54.1 t/s |
| 7,680 MiB | Q5_K_M | 122.8-123.7 t/s | Q6_K 30/33, 46.8-49.5 t/s |
| 8,192 MiB | Q6_K | 119.1-120.1 t/s | Q8_0 25/33, 19.0-23.3 t/s |
| 10,932 MiB, 12 GB card with a desktop | Q8_0 | 117.2-117.3 t/s | none |
The 10,932 MiB row is a 12 GB card counted the same way: 12×10⁹ bytes is 11,444 MiB, minus 512. Q6_K passed at 8,192 MiB by only 20 MiB: the log says will leave 74001 >= 73981. A real 8 GB card with slightly less free could lose a layer, so run the check in Step 4.
Speeds once layers move depend heavily on your CPU. Ours used 64 threads on an EPYC 7742 server, with a load average of about 20 or less when each run started. We did not run a desktop CPU, so expect the split rows to differ the most on your machine.
Choosing before you download
You can estimate this from the file size, which Hugging Face shows before you download anything. For the five files above, at -c 8192 with no vision file, every layer on the GPU and no budget, peak memory ran from 138 MiB under the file size to 475 MiB over it. Part of each file stays in CPU memory (the log's CPU_Mapped line), and the rest of the cost is context, buffers and memory outside the log's totals. For Q4_K_M those are 306 MiB, 112 MiB and 493 MiB. On top of that --fit keeps a margin of 1,024 MiB free by default.
Take your free memory in GB and subtract the file size. Read the memory with nvidia-smi --query-gpu=memory.free --format=csv, and multiply MiB by 1.0486 and divide by 1,000 to get GB, so 7,680 MiB is 8.05 GB. We ran 14 combinations of budget and file. Ten are in the tables above. The other four: on 7,117 MiB, Q3_K_M kept every layer, Q6_K kept 26 and Q8_0 kept 20, and on 8,192 MiB Q5_K_M kept every layer.
| Free memory minus file size | What happened at -c 8192 with --no-mmproj |
|---|---|
| 1.5 GB or more | All 6 combinations kept every layer |
| 1 to 1.5 GB | Both combinations kept every layer, one of them by 20 MiB |
| Under 1 GB | All 6 combinations lost layers |
All 6 combinations with 1.5 GB or more kept every layer; the tightest had 1.78 GB. Between 1 and 1.5 GB, try it and check. We drew these lines from these same runs, on one model, so treat them as a first guess and not as a tested rule. The room a file needs also differs by file. Working back from each file's peak memory and the 20 MiB case above, we calculate about 1.51 GB for Q3_K_M, 1.37 for Q4_K_M, 1.24 for Q5_K_M, 1.11 for Q6_K and 0.86 for Q8_0. Those are calculations and not runs, and Q3_K_M itself comes out just over the 1.5 GB line, so a smaller file may need more.
Do not add the vision file to this sum. On the card it cost 1.18 GB, more than its 0.92 GB on disk. Q4_K_M with its vision file at 7,680 MiB has 1.19 GB of room once you count that cost, and it still lost two layers. A longer context costs more too. For that, we plan a later episode built on our two-run method for picking -c.
Step 3: if you are one size short, lower the margin
--fit keeps 1,024 MiB free by default. Q6_K peaked at 7,210 MiB with no budget, which is under our 7,680 MiB, but not by the 1,024 MiB --fit wants. That margin is what pushed those three layers off. -fitt sets it. This is the command for a real card:
./build/bin/llama cli -hf unsloth/Qwen3.5-9B-GGUF:Q6_K --no-mmproj -c 8192 -fitt 256 \
  -st -n 128 --reasoning off \
  -p "Explain in three paragraphs what a GPU does."
We did not run this exact command on a real card. On the A100 we used -fitt 73725, which leaves the same room. Every row below is on the 7,680 MiB budget at -c 8192:
| Setup | Margin | Layers on GPU | Peak GPU memory | Speed |
|---|---|---|---|---|
Q6_K, --no-mmproj | 1,024 MiB (default) | 30/33 | 6,682 MiB | 46.8-49.5 t/s |
Q6_K, --no-mmproj | 256 MiB | 33/33 | 7,210 MiB | 118.6-120.1 t/s |
Q4_K_M with vision file, one image sent | 1,024 MiB (default) | 31/33 | 6,688 MiB | 74.0 t/s (one run) |
Q4_K_M with vision file, one image sent | 256 MiB | 33/33 | 6,964 MiB | 130.3 t/s (one run) |
If you need images on a small card, try the last row first. On a real card it looks like this:
./build/bin/llama cli -hf unsloth/Qwen3.5-9B-GGUF:Q4_K_M -c 8192 -fitt 256 --image your-image.png \
  -st -n 128 --reasoning off \
  -p "Explain in three paragraphs what a GPU does."
Our run used -fitt 73725 for the same room, one chart image that the log shows resized to 1,248 by 576 pixels, and --verbose. A bigger image or a longer conversation may need more, and we did not test either.
A smaller margin is a real trade. On this budget Q6_K leaves 470 MiB by peak memory, and that has to cover anything else that starts on the card. We did not test what happens when a real card runs out, so watch nvidia-smi the first time and go back to the default if you share the card.
Step 4: check that it really fits
The normal output tells you little about any of this. Our budget runs printed the answer and a speed line, and no mention of layers or context. The one hint is a line near the top: modalities : text, vision, video means the vision file is loaded, and modalities : text means it is not.
To see the decision, add --verbose and filter it:
./build/bin/llama cli -hf unsloth/Qwen3.5-9B-GGUF:Q6_K --no-mmproj -c 8192 \
  -st -n 128 --reasoning off \
  -p "Explain in three paragraphs what a GPU does." --verbose 2>&1 \
  | grep -E "offloaded|model buffer size|Generation:" | tail -4
The output has several early lines from --fit trying sizes, with 0.00 MiB, so tail keeps the real ones. Our Q6_K run on the 7,680 MiB budget ended like this, with the timestamps at the start of the lines removed:
load_tensors: offloaded 30/33 layers to GPU
load_tensors:   CPU_Mapped model buffer size =  1320.47 MiB
load_tensors:        CUDA0 model buffer size =  5781.86 MiB
[ Prompt: 174.5 t/s | Generation: 49.9 t/s ]
Read two things. 30/33 is less than all, so this file is too big for the budget. CPU_Mapped is about twice what our fitting Q5_K_M shows, 666.88 MiB. A number there is normal, so the layer count is what decides. In episode 1 we said not to trust the offloaded line alone, because --device none also prints a full count. So read it together with the CUDA0 line, as here.
--verbose barely moved the speed where we compared it. On split runs the ranges overlapped: Q8_0 read 18.7-19.8 t/s with it and 18.6-19.1 without, and Q6_K 45.1-49.9 and 46.8-49.5. The plain command ran up to a few percent lower with it, 100.9-102.2 against 101.2-106.9. So the speed line in this check is usable as a rough guide.
Two more things to watch
-ngl 99. Older guides use this, and on a budget it switches off the layer moving. We added it to a Q8_0 run on the 7,117 MiB budget, and the log said failed to fit params to free device memory: n_gpu_layers already set by user to 99, abort. It then loaded 33/33 layers and peaked at 8,948 MiB, far past the budget. That was harmless only because the card has 80 GB. We did not run that on a card that really is smaller, and we expect it to fail there. Leave -ngl unset, as in episode 1.
The same name from another publisher. Q4_K_M from bartowski/Qwen_Qwen3.5-9B-GGUF is 6.17 GB, against 5.68 GB from unsloth. It loaded as 34/34 layers at 5,996 MiB and ran at 129.7-130.2 t/s (-c 8192, no budget). Its log lists an extra block, blk.32, and marks 15 of those tensors as unused. They account for about 259 MB of the 489 MB difference, and we did not trace the rest or compare the answers. So check the size of the file you are about to download, and do not go by the name.
If it breaks
These all come from our logs. Only the build failure in the last row stops anything. In the others, the program still runs and answers.
| What you see | Cause | Fix |
|---|---|---|
| Speed far below what others report, no error | --fit moved layers to the CPU | Run the Step 4 check. Add --no-mmproj, or pick a smaller file, or lower the margin |
| Context is 4,096 although you did not ask for it | --fit cut an unset context to make room, down to its floor | Same as above. Add --no-mmproj first |
Adding -c 8192 made it slower | A set context can no longer shrink, so more layers move | Add --no-mmproj first, or pick a smaller file |
| 14.6 GB of GPU memory for a 5.68 GB file | With -c unset and room to spare, the context is the model's full 262,144 tokens. We saw 13,948 MiB without the vision file | Set -c to what you need |
Log line failed to fit params ... n_gpu_layers already set by user | Setting -ngl yourself stops the layer moving, so the file may not fit | Remove -ngl |
Build fails: class "ncclConfig_v21400" has no member "maxCTAs" | Newer llama.cpp found an older NCCL library on our machine (commit 71efc559a, still in master on November 3) | Add -DGGML_CUDA_NCCL=OFF when you configure. Every run here used that build, on one card at a time. We did not test several cards |
What you have now
One file for your card, chosen by its size and your free memory, plus a four-line check that shows how many layers really landed on the GPU. On our 7,680 MiB budget that file is Q5_K_M with --no-mmproj -c 8192. What we tested is one model, one build and one A100 under a budget. We did not test a real 8 GB card, a desktop CPU or running out of memory.
Next, we plan to serve this model as an API with llama serve.